
Get the most accurate NCERT Solutions for Class 11 Economics Chapter 6 Correlation here. Updated for the 2026-27 academic session, these solutions are based on the latest NCERT textbooks for Class 11 Economics. Our expert-created answers for Class 11 Economics are available for free download in PDF format.
Detailed Chapter 6 Correlation NCERT Solutions for Class 11 Economics
For Class 11 students, solving NCERT textbook questions is the most effective way to build a strong conceptual foundation. Our Class 11 Economics solutions follow a detailed, step-by-step approach to ensure you understand the logic behind every answer. Practicing these Chapter 6 Correlation solutions will improve your exam performance.
Class 11 Economics Chapter 6 Correlation NCERT Solutions PDF
NCERT Solution for Class 11 Statistics for chapter 7 Correlation
Q1. The unit of correlation coefficient between height in feet and weight in kgs is
(i). Kg/feet
(ii). Percentage
(iii). non-existent
Answer.
(iii) Non-existent
Explanation: Correlation coefficient has no unit. It is pure numeric term used to measure the degree of association between variables.
Q2. The range of simple correlation coefficient is
(i). 0 to infinity
(ii). Minus one to plus one
(iii). Minus infinity to infinity
Answer.
(ii) Minus one to plus one
Explanation: The value of correlation coefficient lies between minus one to plus one, if the value lies outside this range it indicates error in calculation.
Q3. If rxy is positive the relation between X and Y is of the type
(i). When Y increases X increases
(ii). When Y decreases X increases
(iii). When Y increases X does not change
Answer.
(i) When Y increases X increases
Explanation: A positive correlation implies that both the variables move in a similar direction. If there is a increase in X, Y also increases in same direction.
Q4. If rxy = 0 the variable X and Y are
(i). Linearly related
(ii). Not linearly related
(iii). Independent
Answer.
(ii) Not linearly related
Explanation: If rxy = 0, it means that there is a absence of linear relation between the variables, but there may exist a non linear relation between variables.
Q5. Of the following three measures which can measure any type of relationship
(i). Karl Pearson’s coefficient of correlation
(ii). Spearman’s rank correlation
(iii). Scatter diagram
Answer.
(ii) Spearman’s rank correlation
Explanation: Spearman’s rank correlation is the measure which can measure any type of relationship. But, Karl Pearson’s coefficient is the most widely used method due to the preciseness of the ‘r’ value.
Q6. If precisely measured data are available the simple correlation coefficient is
(i). More accurate than rank correlation coefficient
(ii). Less accurate than rank correlation coefficient
(iii). as accurate as the rank correlation coefficient
Answer.
(iii) As accurate as the rank correlation coefficient
Q7. Why is r preferred to covariance as a measure of association?
Answer.
“r” i.e. correlation coefficient is preferred to covariance as a measure of association because
- r is independent of change in scale and origin.
- r has a specific range (-1 to +1 ), so it comes handy to interpret the results quickly.
- Covariance is a part of correlation coefficient.
Q8. Can r lie outside the -1 and 1 range depending on the type of data?
Answer.
No, value of r cannot lie outside the range -1 and 1 depending on the type of data. If r = 1 or -1 that means there is a perfect positive or perfect negative relation between variables and if r = 0 that means there isn’t any correlation. But, if value of r lies outside the range -1 and 1, then it indicates that there is an error in calculation.
Q9. Does correlation imply causation?
Answers.
No, correlation does not imply causation. Correlation only implies association between two variables. It doesn’t represent any cause and effect relation between the two variables. Correlation between two variables only means that two variables are either positively or negatively or neither related at all. It only measures the degree and intensity of the relation between the variables. For example marks scored by a student in exams is correlated to number of days the student went to school but the marks scored by him doesn’t depend on the number of days he went to school.
Q10. When is rank correlation more precise than simple correlation coefficient?
Answer.
Rank correlation is more precise than simple correlation coefficient in situations when it is required quantify qualities. Ranking is a better alternative for quantification of qualities, which can’t be done in simple correlation. It is also useful when correlation coefficient between two variables with extreme values is quite different from the coefficient without the extreme values. For example, in a beauty contest judges may have to prepare a list of participants in order of their beauty. There is no procedure or numerical system which judges beauty, so in order to prepare a list judges rank the participants based on their features. In this manner rank correlation can be used which gives more precise value than the simple correlation.
Q11. Does zero correlation mean independence?
Answer.
No, zero correlation doesn’t mean independence. Zero correlation only indicates absence of a linear relation between the variables. There might exist a non-linear relation between them, thus zero correlation necessarily doesn’t mean independence.
Q12. Can simple correlation coefficient measure any type of relationship?
Answer.
No, simple correlation is not able to measure all the types of relationship. It can only measure linear relationships between the variables. It is not able to interpret the non-linear relationships between the variables. In case correlation coefficient returns the value zero it either means there is no correlation or there is non- linear relationship which cannot be measured.
Q13. Collect the price of five vegetables from your local market every day for a week. Calculate their correlation coefficients. Interpret the result.
Answer.
(Hypothetical example, answer may vary)
|
Day |
Potato (per kg) |
Tomato (per kg) |
Onion (per kg) |
Babycorn (per kg) |
Broccoli (per kg) |
|
1 |
18 |
30 |
35 |
110 |
170 |
|
2 |
18 |
35 |
36 |
112 |
165 |
|
3 |
18 |
32 |
35 |
120 |
150 |
|
4 |
20 |
32 |
34 |
118 |
155 |
|
5 |
20 |
35 |
36 |
115 |
155 |
|
6 |
20 |
35 |
35 |
110 |
160 |
|
7 |
21 |
32 |
35 |
111 |
165 |
Correlation between prices of potato and tomato
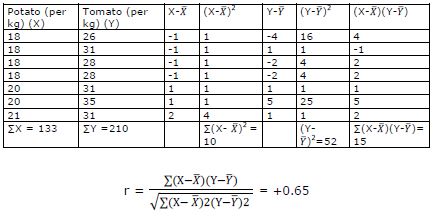
Likewise we can calculate correlation between different pairs of vegetables or we can use multivariate correlation to find the relation between the vegetables.
Q14. Measure the height of your classmates. Ask them the height of their bench mate. Calculate the correlation coefficient of these two variables. Interpret the result.
Answer.
(Hypothetical example, results may vary)
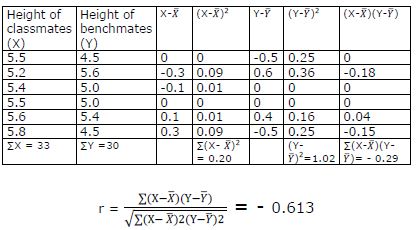
Correlation coefficient between the height of classmate and height of his bench mate are negatively related.
Q15. List some variables where accurate measurement is difficult.
Answer.
Some of the variables for which accurate measurement is difficult are:
- Beauty
- Honesty
- Intelligence
- Ability
- Bravery
- Fairness, etc
Q16. Interpret the values of r as 1,-1 and 0
Answer.
r = 1 implies there is a perfect positive correlation between the variables.
r = -1 implies there is a perfect negative correlation between the variables
r = 0 implies there is no correlation between the variables.
Q17. Why does rank correlation coefficient differ from Pearsonian correlation coefficient?
Answer.
Rank coefficient differs from pearsonian correlation coefficient because in rank coefficient, specific ranks are assigned to the data which leads to loss of information and all the information regarding the data is not utilised. Only if the data in the rank coefficient method is ranked precisely, it leads to similar values as the pearsonian coefficient. . The value of rank coefficient also differs due to the first differences of the value of items in the series arranged are almost never constant. Generally, both the methods result in same value of ‘r’; but pearsonian coefficient is more widely used than rank coefficient as it utilizes information from the whole series of frequency distribution.
Q18. Calculate the correlation coefficient between the height of fathers in inches (X) and their sons (Y)
|
X |
65 |
66 |
57 |
67 |
68 |
69 |
70 |
72 |
|
Y |
67 |
56 |
65 |
68 |
72 |
72 |
69 |
71 |
Answer.
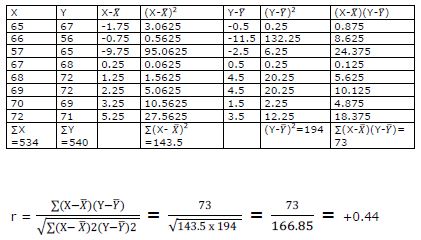
There is a positive correlation between height of fathers and their sons.
Q19. Calculate the correlation coefficient between X and Y and comment on their relationship:
|
X |
-3 |
-2 |
-1 |
1 |
2 |
3 |
|
Y |
9 |
4 |
1 |
1 |
4 |
9 |
Answer.
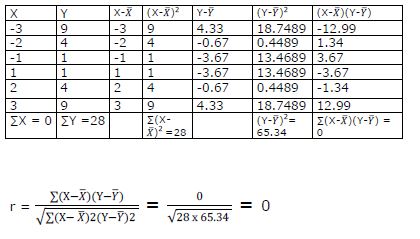
Correlation coefficient between X and Y is zero. This means that X and Y have no linear relation between them.
(They a have a non-linear relationship Y = X2)
Q20. Calculate the correlation coefficient between X and Y and comment on their relationship
|
X |
1 |
3 |
4 |
5 |
7 |
8 |
|
Y |
2 |
6 |
8 |
10 |
14 |
16 |
Answer.
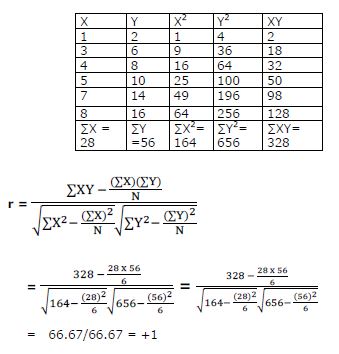
Correlation coefficient between X and Y is +1. There is a perfect positive correlation between X and Y. If there is a change in X, then there is equi-proportional change in Y.
Free study material for Economics
NCERT Solutions Class 11 Economics Chapter 6 Correlation
Students can now access the NCERT Solutions for Chapter 6 Correlation prepared by teachers on our website. These solutions cover all questions in exercise in your Class 11 Economics textbook. Each answer is updated based on the current academic session as per the latest NCERT syllabus.
Detailed Explanations for Chapter 6 Correlation
Our expert teachers have provided step-by-step explanations for all the difficult questions in the Class 11 Economics chapter. Along with the final answers, we have also explained the concept behind it to help you build stronger understanding of each topic. This will be really helpful for Class 11 students who want to understand both theoretical and practical questions. By studying these NCERT Questions and Answers your basic concepts will improve a lot.
Benefits of using Economics Class 11 Solved Papers
Using our Economics solutions regularly students will be able to improve their logical thinking and problem-solving speed. These Class 11 solutions are a guide for self-study and homework assistance. Along with the chapter-wise solutions, you should also refer to our Revision Notes and Sample Papers for Chapter 6 Correlation to get a complete preparation experience.
FAQs
The complete and updated is available for free on StudiesToday.com. These solutions for Class 11 Economics are as per latest NCERT curriculum.
Yes, our experts have revised the as per 2026 exam pattern. All textbook exercises have been solved and have added explanation about how the Economics concepts are applied in case-study and assertion-reasoning questions.
Toppers recommend using NCERT language because NCERT marking schemes are strictly based on textbook definitions. Our will help students to get full marks in the theory paper.
Yes, we provide bilingual support for Class 11 Economics. You can access in both English and Hindi medium.
Yes, you can download the entire in printable PDF format for offline study on any device.