
Refer to CBSE Class 6 Maths Data Handling HOTs. We have provided exhaustive High Order Thinking Skills (HOTS) questions and answers for Class 6 Mathematics Chapter 9 Data Handling. Designed for the 2026-27 exam session, these expert-curated analytical questions help students master important concepts and stay aligned with the latest CBSE, NCERT, and KVS curriculum.
Chapter 9 Data Handling Class 6 Mathematics HOTS with Solutions
Practicing Class 6 Mathematics HOTS Questions is important for scoring high in Mathematics. Use the detailed answers provided below to improve your problem-solving speed and Class 6 exam readiness.
HOTS Questions and Answers for Class 6 Mathematics Chapter 9 Data Handling
HOTS
Preference of people in playing different games over the years is given in the bar graph. Read the graph and answer the questions that follow. 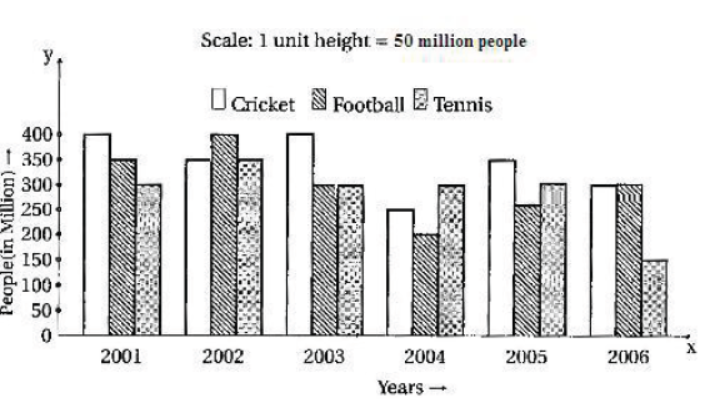
1. In the year 2006, the people preferring to play tennis is what percent of the people preferring to play cricket, football and tennis together in that year?
Answer: 20%
2. From 2001 to 2006, find the total number of people who preferred to play football.
Answer: 1800 million
3. The number of people preferring to play tennis in 2006 is how many million fewer than the number of people preferring to play tennis in 2005?
Answer: 150 million
4. What is the ratio of the number of people preferring to play cricket to the number of people preferring to play tennis in the year 2003?
Answer: 4 : 3
5. How many people (in million) have preferred to play cricket in all the years together?
Answer: 2050 million
SUMMARY
1. The collection of facts in the form of numerical values is called the data.
2. Each numerical figure in a data is called an observation.
3. The number of times a particular observation occurs in a data is called the frequency of that observation.
4. A table showing the frequency of various observations is called the frequency distribution table.
5. A representation that shows numerical information by using pictures or symbols is called a pictograph.
6. A bar graph is a pictorial representation of data in which bars of equal width are erected vertically or horizontally with equal spacing between them. The height or length of a bar represents the corresponding value of the data.
ERRORANALYSIS
1. Tally marks are incorrectly drawn by students.
2. Scale is not mentioned in a bar graph and a pictograph.
3. Labelling of axis is not done.
4. Equal spacing between bars is not maintained.
5. Bars are not of uniform width.
ACTIVITY I
To collect the data from the students regarding time spent (more than 2 hours) watching TV and to present the data in the form of a bar graph by paper cutting and pasting.
Material required : Coloured and white papers, sketch pens, a pair of scissors, a pencil and glue
Procedure
Step 1 : Record the number of hours spent during a day by each student in the class watching TV in Table 1.
Step 2 : List the students who spent more than 2 hours a day watching TV in Table 2 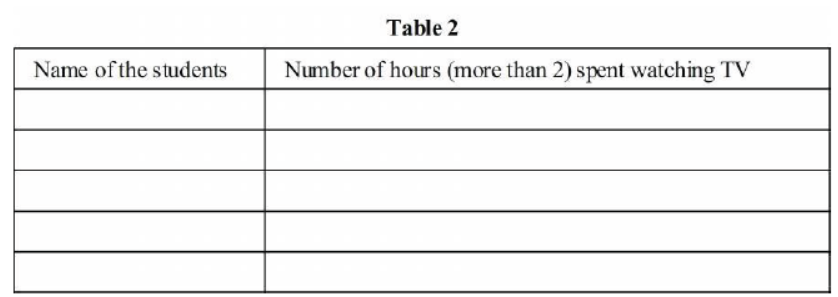
Step 3 : To make a bar graph of the data in Table 2, draw two lines (one horizontal and one vertical as shown in Fig. (a) 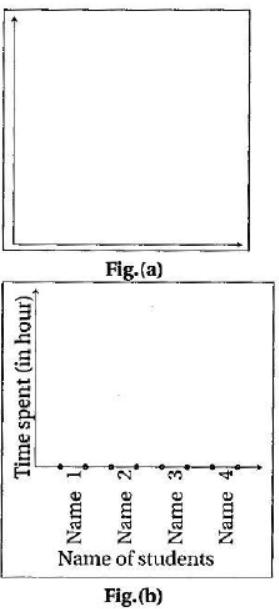
Step 4 : Write the names of the students in Table 2 along the horizontal line at equal distances and time spent (in hours) along the vertical line. [Fig. (b)]
Step 5 : Now make strips of uniform width of different colours, for each student, of length according to time (in hours) spent by him/her in watching TV (see Table 2)
Step 6 : Paste these strips in Fig. (b) accordingly against the names of the students.
Observations:
a. The number of students who spent 2 to 3 hours watching TV in a day =......
b. The name(s) of student(s) who spent more than 6 hours a day watching TV are.....
c. The name(s) of the student (s) who spent maximum time watching TV are .......
d. The name(s) of the student(s) who spent exactly 2 hours a day watching TV is/are ..........
ACTIVITY II
We know a die is a cube where 6 faces are marked with numbers or dots from 1 to 6, one number on each face. Recall, we use a die while playing Ludo or Snake and ladder.
Throw a die 20 times and write the result of each throw in the following table: 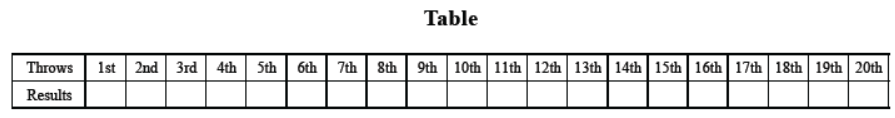
On the basis of the above data, answer the following questions:
a. How many times has 6 occurred?
b. How many times has a number more than 3 occurred?
c. How many times has a number less than 4 occurred?
Free study material for Mathematics
HOTS for Chapter 9 Data Handling Mathematics Class 6
Students can now practice Higher Order Thinking Skills (HOTS) questions for Chapter 9 Data Handling to prepare for their upcoming school exams. This study material follows the latest syllabus for Class 6 Mathematics released by CBSE. These solved questions will help you to understand about each topic and also answer difficult questions in your Mathematics test.
NCERT Based Analytical Questions for Chapter 9 Data Handling
Our expert teachers have created these Mathematics HOTS by referring to the official NCERT book for Class 6. These solved exercises are great for students who want to become experts in all important topics of the chapter. After attempting these challenging questions should also check their work with our teacher prepared solutions. For a complete understanding, you can also refer to our NCERT solutions for Class 6 Mathematics available on our website.
Master Mathematics for Better Marks
Regular practice of Class 6 HOTS will give you a stronger understanding of all concepts and also help you get more marks in your exams. We have also provided a variety of MCQ questions within these sets to help you easily cover all parts of the chapter. After solving these you should try our online Mathematics MCQ Test to check your speed. All the study resources on studiestoday.com are free and updated for the current academic year.
FAQs
You can download the teacher-verified PDF for CBSE Class 6 Maths Data Handling HOTs from StudiesToday.com. These questions have been prepared for Class 6 Mathematics to help students learn high-level application and analytical skills required for the 2026-27 exams.
In the 2026 pattern, 50% of the marks are for competency-based questions. Our CBSE Class 6 Maths Data Handling HOTs are to apply basic theory to real-world to help Class 6 students to solve case studies and assertion-reasoning questions in Mathematics.
Unlike direct questions that test memory, CBSE Class 6 Maths Data Handling HOTs require out-of-the-box thinking as Class 6 Mathematics HOTS questions focus on understanding data and identifying logical errors.
After reading all conceots in Mathematics, practice CBSE Class 6 Maths Data Handling HOTs by breaking down the problem into smaller logical steps.
Yes, we provide detailed, step-by-step solutions for CBSE Class 6 Maths Data Handling HOTs. These solutions highlight the analytical reasoning and logical steps to help students prepare as per CBSE marking scheme.