

Download CBSE Class 12 Biology Useful Resources
Explore structured advanced study materials through the CBSE Class 12 Biology Environmental Issues diagrams based questions. Tailored for Class 12 learners, utilizing these Biology resources ensures thorough preparation and strengthens foundational knowledge before final CBSE evaluations.
Access CBSE Study Guides and Summaries
View or download the dedicated CBSE Class 12 Biology Environmental Issues diagrams based questions resource below. Engaging with these advanced study guides under focused conditions ensures continuous academic progress and mastery of the 2026-27 curriculum for Chapter 16 Environmental Issues.
CBSE Class 12 Biology Environmental Issues diagrams based questions. Please refer to the examination notes which you can use for preparing and revising for exams. These notes will help you to revise the concepts quickly and get good marks.
These CBSE Class 12 Biology diagram based questions on the chapter Environmental Issues cover dissolved oxygen and BOD in a river, electrostatic precipitators, flue gas desulphurisation, biomagnification, greenhouse gases, the ozone hole, global warming, vehicular emission standards and the Chipko movement. Each question has its figure, a full answer and a Teacher's Note for board exam revision.
16. Environmental Issues
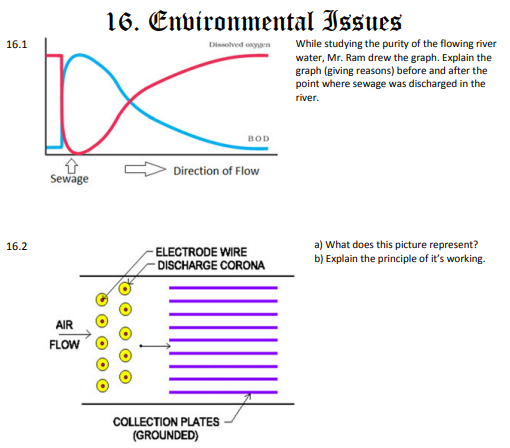
16.1 While studying the purity of the flowing river water, Mr. Ram drew the graph. Explain the graph (giving reasons) before and after the point where sewage was discharged in the river.
[Figure: Line graph with Direction of Flow on the horizontal axis and a point marked Sewage on the left. A red line labelled Dissolved oxygen starts high, drops sharply to its lowest value just after the sewage point, and then rises gradually to a high value again further downstream. A blue line labelled BOD starts low, rises sharply just after the sewage point to a peak, and then falls gradually to a low value further downstream.]
Answer:
1. Before the sewage point: dissolved oxygen is high and BOD is low, because the river water is clean and has enough oxygen for aquatic life.
2. At and just after the sewage point: BOD rises sharply, because sewage contains a large amount of organic matter that needs oxygen for decomposition by bacteria.
3. Dissolved oxygen falls sharply to its lowest value, because the oxygen is used up in decomposing the organic waste.
4. Further downstream: BOD gradually falls and dissolved oxygen gradually rises, because the river recovers by self purification as the waste is decomposed and oxygen is replenished from the air.
Teacher's Note:
a) BOD means biochemical oxygen demand, the oxygen that bacteria need to break down organic matter.
b) A high BOD and a low dissolved oxygen level mean the water is polluted.
c) Self purification is slow, so the recovery of the river takes some distance downstream.
16.2
[Figure: Diagram of an electrostatic precipitator. Air flow enters from the left through a set of yellow circles that represent electrode wires, labelled ELECTRODE WIRE and DISCHARGE CORONA. A dotted line shows the path of particles moving towards the purple vertical collection plates on the right, which are labelled COLLECTION PLATES (GROUNDED). The top and bottom of the chamber are shown as horizontal lines.]
a) What does this picture represent?
Answer: The picture represents an electrostatic precipitator, a device used to remove dust and smoke particles from the air or flue gases.
Teacher's Note:
a) It is fitted in chimneys of thermal power plants and cement factories.
b) It removes particulate matter, not gases such as sulphur dioxide.
b) Explain the principle of it's working.
Answer:
1. The electrode wires are given a very high negative voltage, which produces a corona discharge around them.
2. The corona ionises the gas molecules, and the dust particles in the air pick up negative charges.
3. The charged dust particles move towards the earthed (grounded) collection plates under the electric field.
4. The particles stick to the collection plates, and the clean air passes out.
5. The collected dust is removed by tapping the plates.
Teacher's Note:
a) The principle is that charged particles move in an electric field and get deposited on oppositely charged surfaces.
b) The collection plates must be earthed, because a charged plate would repel the charged dust.
c) Very fine particles are removed with high efficiency, which is why the device is used in industry.
16.3 What is the use of this apparatus? Explain the process.
[Figure: Tall tower with a clean gas outlet at the top labelled clean gas. Inside the tower, spray towers are shown with spray nozzles. Flue gas enters from the side of the tower. Below the tower is a tank labelled bottom fraction containing stirrers, a circulation pump, oxidising gas inlet on the left, a limestone inlet on the right and gypsum at the bottom outlet.]
Answer:
1. The apparatus is a flue gas desulphurisation (FGD) unit, which removes sulphur dioxide from the flue gases of thermal power plants before they are released into the air.
2. Flue gas enters the tower and rises through a spray of limestone slurry (calcium carbonate).
3. Sulphur dioxide reacts with the slurry: CaCO3 + SO2 → CaSO3 + CO2.
4. The calcium sulphite is oxidised with the oxidising gas (air) to form calcium sulphate: 2CaSO3 + O2 + 4H2O → 2CaSO4·2H2O.
5. The calcium sulphate, which is gypsum, settles at the bottom and is removed, while the clean gas leaves from the top.
Teacher's Note:
a) Sulphur dioxide causes acid rain, so removing it protects soil, water and buildings.
b) The gypsum produced is used in cement and plaster of Paris.
c) Limestone is cheap and easily available, which makes the process practical.
16.4 What does the diagram represent? Define the term. Why does such happen?
[Figure: Food chain diagram from bottom to top with arrows. Water has 0.000003 ppm. Zooplankton has 0.04 ppm. Small fish has 0.5 ppm. Large fish has 2 ppm. Fish-eating birds of prey have 25 ppm.]
Answer:
1. The diagram represents biomagnification.
2. Biomagnification is the increase in the concentration of non-biodegradable toxic substances, such as DDT or mercury, at each higher trophic level of a food chain.
3. Such a thing happens because these substances are not broken down or excreted by the body, so they accumulate in the fatty tissues of organisms.
4. A predator eats many prey, so the toxin from all of them builds up in the predator's body, and the top predators have the highest concentration.
Teacher's Note:
a) Biomagnification increases the toxin level from water at each step, about 25 ppm in birds compared to 0.000003 ppm in water.
b) Fat soluble pesticides like DDT are the classic example of this effect.
c) Top consumers such as eagles and hawks are the worst affected, which can cause thin eggshells and fewer chicks.
16.5 Select the correct option:
[Figure: Pie chart showing the percentage contribution of greenhouse gases. CO2 occupies the largest part of the pie, about 55 per cent, shown in blue. CFCs are shown in yellow, Methane in maroon, Nitrous Oxide in light blue and Halocarbons as a very thin dark purple slice.]
(a) CFC (14%), Methane (20%)
(b) CFC (20%), Methane (14%)
Answer: (b) CFC (20%), Methane (14%)
Teacher's Note:
a) In this chart CFCs contribute about 20 per cent and methane about 14 per cent of the greenhouse effect.
b) Carbon dioxide contributes the largest share, about 55 per cent.
c) CFCs are very long lived in the atmosphere, and each molecule traps far more heat than a molecule of carbon dioxide.
16.6
[Figure: Two satellite images of the Earth viewed from the South Pole, side by side. The left image is labelled 1979 and shows the ozone layer as green and blue with no large dark patch. The right image is labelled 2008 and shows a large dark blue to purple patch over Antarctica, which is the ozone hole. A colour scale labelled Total Ozone (Dobson Units) runs from purple (low, about 100 to 220) to red (high, about 500).]
a) What is shown in this picture?
Answer: The picture shows the depletion of the ozone layer over Antarctica, the ozone hole, which has grown larger between 1979 and 2008.
Teacher's Note:
a) Dobson Units measure the total amount of ozone in a column of the atmosphere.
b) Low values in purple show the thinnest part of the ozone layer.
b) What is the cause?
Answer: The main cause is the release of chlorofluorocarbons (CFCs), halons and other ozone depleting substances, which release chlorine atoms in the stratosphere. Chlorine breaks down ozone molecules and is not used up in the reaction, so one chlorine atom can destroy many ozone molecules.
Teacher's Note:
a) CFCs were used in refrigerators, air conditioners and aerosol sprays.
b) The Montreal Protocol of 1987 was signed to phase out these chemicals.
c) What is the effect on human beings?
Answer:
1. Ozone absorbs harmful ultraviolet (UV-B) radiation, so a thinner ozone layer allows more UV radiation to reach the earth.
2. More UV radiation increases the risk of skin cancer and cataract of the eyes.
3. It weakens the immune system and makes people more prone to infections.
Teacher's Note:
a) UV-B radiation damages the DNA in skin cells, which leads to skin cancer.
b) Plants and phytoplankton are also harmed by high UV radiation.
c) Sunscreen, protective clothing and shade reduce the exposure to UV radiation.
16.7 Give a suitable caption for this image. What is the cause for this situation?
[Figure: Photograph of the Earth shown as a globe with its surface glowing and surrounded by fire and smoke, with the continents of the Americas visible in green.]
Answer:
1. Suitable caption: Global warming, the Earth is on fire.
2. Cause: The increase in greenhouse gases such as carbon dioxide and methane in the atmosphere, mainly from burning of fossil fuels, deforestation and industrial activities, traps more heat and raises the average temperature of the Earth.
Teacher's Note:
a) The greenhouse effect is natural, but human activities have made it much stronger.
b) Deforestation reduces the number of trees that absorb carbon dioxide.
c) Global warming leads to melting of glaciers, rise in sea levels and changes in rainfall patterns.
16.8 What is this drive taken by the Government of India?
[Figure: Close view of the back of a vehicle showing a green sticker labelled Clean and Green with a large leaf and the words Bharat IV.]
Answer: The drive is the Bharat Stage IV (BS-IV) emission norms, which set limits on the pollutants released by new vehicles, to control vehicular pollution and make the air cleaner.
Teacher's Note:
a) Bharat Stage norms are based on European emission standards and are set by the central government.
b) BS-IV norms reduce emissions of sulphur, nitrogen oxides and particulate matter from vehicles.
c) Vehicles that meet these norms carry the Bharat Stage label.
16.9 How has the Delhi Government reduced such pollution?
[Figure: Photograph of the rear of a grey vehicle with smoke coming out of its exhaust pipe onto a paved road.]
Answer:
1. Public transport such as buses and auto rickshaws was converted to run on compressed natural gas (CNG).
2. Strict emission standards were applied to vehicles, and older and polluting vehicles were phased out.
3. The metro rail network was expanded to reduce the number of private vehicles on the roads.
Teacher's Note:
a) CNG burns much more cleanly than diesel and petrol, releasing less particulate matter.
b) The conversion followed a Supreme Court order in the early 2000s.
c) Reducing the number of vehicles on the road is as important as making each vehicle cleaner.
16.10
[Figure: Black and white photograph of four women standing close to a large tree trunk, each holding on to the tree. A child stands behind them.]
a) What reminds you seeing this picture?
Answer: The picture reminds us of the Chipko movement, in which people hugged trees to stop them from being cut down.
Teacher's Note:
a) The name Chipko means to stick or to hug in Hindi.
b) The movement is an example of people's participation in forest conservation.
b) Give a brief history.
Answer:
1. The movement started in 1973 in the village of Mandal in the Chamoli district of the Himalayan region of Uttarakhand.
2. Villagers, led by Chandi Prasad Bhatt and Gaura Devi, hugged trees to stop contractors from cutting them down.
3. The protest spread to other Himalayan districts and succeeded in getting a ban on the felling of trees in the region.
Teacher's Note:
a) The movement focused on protecting forests for fuel, fodder and water.
b) Gaura Devi is remembered as one of the leaders who led the women of the village.
c) Chipko is often cited as an early example of grassroots environmental action in India.
Free study material for Biology
Useful Resources and Notes for Class 12 Biology Chapter 16 Environmental Issues
Quick Revision Material for Chapter 16 Environmental Issues
Explore essential learning tools for Class 12 Biology Chapter 16 Environmental Issues. This curated collection features in-depth notes and targeted practice questions built around the active 2026 curriculum to streamline your daily revision.
Expert Notes and Solved Exam Questions
Each resource draws directly from authorized textbooks to maintain academic accuracy. Evaluating solved examples allows Class 12 students to master the formal presentation and answer-writing standards expected in upcoming school exams.
Additional Study Resources for Class 12
For peak performance in upcoming evaluations, integrate official Biology sample papers directly into your study schedule. Follow up your revision by attempting online MCQ tests for Chapter 16 Environmental Issues to refine calculation speed and precision.
FAQs
Our advanced study package for Chapter 16 Environmental Issues includes detailed concepts, diagrams, Mind Maps, and explanation of complex topics to ensure Class 12 students learn as per syllabus for 2026 exams.
The Mind Maps provided for Chapter 16 Environmental Issues act as visual anchors which will help faster recall during high-pressure exams.
Yes, teachers use our Class 12 Biology resources for lesson planning as they are in simple language and have lot of solved examples.
Yes, You can download the complete, mobile-friendly PDF of the Biology Chapter 16 Environmental Issues advanced resources for free.
Yes, our subject matter experts have updated the Chapter 16 Environmental Issues material to align with the rationalized NCERT textbooks and have removed deleted topics and added new competency-based questions.