

Class 12 Biology Study Guide: CBSE Class 12 Biology Biodiversity and Conservation diagrams based questions
Review targeted academic resources with the CBSE Class 12 Biology Biodiversity and Conservation diagrams based questions. Built according to official CBSE standards for the 2026-27 term, these downloadable Class 12 Biology study materials support effective daily practice and deeper conceptual understanding for Chapter 13 Biodiversity and Conservation.
Download Chapter 13 Biodiversity and Conservation Study Material PDF
Navigate directly to the advanced Biology study materials using the digital viewer below. Each resource pack includes detailed conceptual summaries and solved practice questions, allowing students to instantly reinforce their learning.
CBSE Class 12 Biology Biodiversity and Conservation diagrams based questions. Please refer to the examination notes which you can use for preparing and revising for exams. These notes will help you to revise the concepts quickly and get good marks.
These CBSE Class 12 Biology diagram based questions on the chapter Biodiversity and Conservation cover an invasive catfish and water hyacinth, extinct animals such as the Dodo and Quagga, the species area relationship graph, habitat fragmentation and the global distribution of vertebrate species. Each question has its figure, a full answer and a Teacher's Note for board exam revision.
15. Biodiversity and Conservation
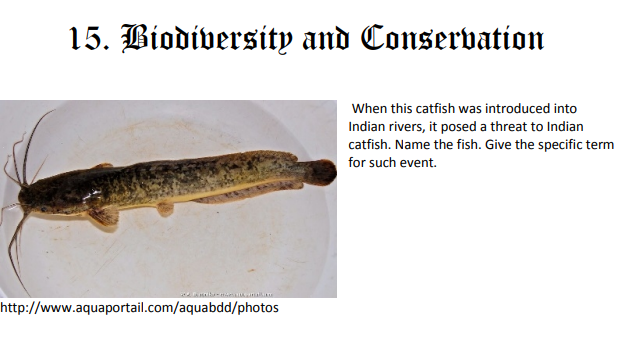
15.1 When this catfish was introduced into Indian rivers, it posed a threat to Indian catfish. Name the fish. Give the specific term for such event.
[Figure: Photograph of a long, dark brown and greyish catfish lying on a white plate, with long whiskers around its mouth and a flat, broad head.]
Answer:
1. The fish is the African catfish, Clarias gariepinus.
2. The specific term for such an event is biological invasion, which is the introduction of a non-native species into a new habitat where it spreads and harms native species.
Teacher's Note:
a) African catfish grows fast and eats the eggs and young of native fish.
b) Invasive species are one of the major causes of loss of biodiversity.
15.2
[Figure: Photograph of a floating aquatic plant with rounded, shiny green leaves with swollen leaf stalks and a spike of pale purple flowers rising above the water.]
a) Identify the plant and write the scientific name.
Answer: The plant is water hyacinth, whose scientific name is Eichhornia crassipes.
Teacher's Note:
a) The plant is native to South America and was brought to India as an ornamental plant.
b) Its name in Hindi and English refers to its water-living habit and its flowers.
What was the result of introduction of this plant?
Answer:
1. The plant grew very fast and covered large areas of lakes, ponds and rivers.
2. The thick mat of leaves blocked sunlight and reduced the oxygen in the water, which killed the fish and other aquatic animals.
3. Native plants and animals were pushed out, so biodiversity of the water bodies was reduced.
Teacher's Note:
a) Water hyacinth is one of the most troublesome invasive weeds in Indian water bodies.
b) Reduced oxygen and blocked sunlight are the two main reasons for the damage.
c) The mat also helps mosquitoes breed, which increases the risk of diseases.
15.3 Match the animals with their names.
[Figure: Four photographs placed in a row and labelled A, B, C and D. A shows a zebra-like animal with stripes on the front half of its body. B shows a large grey sea mammal with a rounded head and a smooth body. C shows a striped, wolf-like marsupial animal with a long tail. D shows a large bird with a bulky body, a hooked beak and bluish-green plumage.]
Hints: Dodo / Stellars Sea Cow / Quagga / Thylacine
Answer:
1. A: Quagga.
2. B: Stellar's Sea Cow.
3. C: Thylacine.
4. D: Dodo.
Teacher's Note:
a) All four animals are extinct, and they were lost mainly due to hunting and habitat destruction.
b) The Quagga had stripes only on the front half of its body, unlike the zebra.
c) The Dodo lived on the island of Mauritius and could not fly.
15.4
[Figure: Graph with Area on the horizontal axis and Species richness on the vertical axis. A blue curve labelled S = A (arithmetic scale) rises steeply and then flattens out. A red straight line labelled log-log scale shows Log S rising in a straight line against log of area. The curves are marked A on the blue curve and B on the red line.]
Study the graph and answer the questions.
a) Name a scientist who studied species richness in the South American jungles (as in your text book).
Answer: The scientist is Alexander von Humboldt, who studied species richness in the South American jungles.
Teacher's Note:
a) Humboldt noted that the number of species increases with the area explored.
b) His findings form the basis of the species area relationship.
b) Complete the equations A and B.
Answer:
1. Equation A: S = CAZ, where S is the species richness, A is the area, C is the y-intercept and Z is the slope of the line.
2. Equation B: Log S = Log C + Z Log A, which is the straight line form of the same equation on a log-log scale.
Teacher's Note:
a) Taking logarithms converts the curve into a straight line.
b) The value of Z is the slope of the log-log line.
c) How does the value of Z differ? Give example.
Answer:
1. The value of Z is about 0.1 to 0.2 for small areas, such as a single forest patch or a small island.
2. The value of Z is about 0.6 to 1.2 for large areas, such as a whole continent.
3. For example, for birds and mammals in a whole continent, Z lies in the range of 0.6 to 1.2, while for plants in a small sample area, Z is about 0.1 to 0.2.
Teacher's Note:
a) A larger Z means species richness increases more quickly as the area becomes larger.
b) The Z value depends on the group of organisms and the type of habitat being studied.
c) Students often confuse Z with C, but Z is the slope and C is the intercept.
15.5
[Figure: Two diagrams side by side. The left diagram shows a large continuous green forest patch with many animals inside, marked as interior species, and animals at the edge of the patch marked as edge species. The right diagram shows the same forest split into two smaller patches separated by a gap, with more animals at the edges and fewer in the interior. A dark red arrow points from the left diagram to the right diagram.]
a) What does the diagram represent?
Answer: The diagram represents habitat fragmentation, where a large continuous habitat is broken into smaller and isolated patches.
Teacher's Note:
a) Roads, farms and urban development are common causes of fragmentation.
b) Fragmentation is one of the main causes of loss of biodiversity.
b) Explain the effect.
Answer:
1. The area of interior habitat shrinks, so interior species lose their shelter and food and their numbers decline.
2. Edge species increase, but they may compete with or be preyed upon by other animals.
3. The isolated patches restrict movement and breeding, which reduces gene flow and can lead to local extinction.
Teacher's Note:
a) Interior species need large undisturbed habitats to survive.
b) Small isolated populations are more likely to become extinct because they have less genetic variation.
c) Corridors that connect the patches can help animals move between them.
15.6 The figure represents Global Biodiversity of Vertebrates in proportionate number of species. Identify A to D from the hints below.
[Figure: Pie chart titled Vertebrates in a box at the top left. The largest slice is labelled Fishes. Four smaller slices are labelled A (orange slice at the top), B (light blue slice on the right), C (yellow slice at the bottom right) and D (light green slice at the bottom left).]
Hints: Amphibians, Reptiles, Birds, Mammals
Answer:
1. A: Mammals.
2. B: Reptiles.
3. C: Birds.
4. D: Amphibians.
Teacher's Note:
a) Fishes form the largest group of vertebrates, with about 31,000 known species.
b) Birds are the largest of the four land groups, with about 10,000 known species.
c) Mammals are the smallest group among the four, with about 5,500 known species.
Free study material for Biology
Free CBSE Study Guides: Class 12 Biology Chapter 13 Biodiversity and Conservation
Essential Notes for Class 12 Biology
Explore essential learning tools for Class 12 Biology Chapter 13 Biodiversity and Conservation. This curated collection features in-depth notes and targeted practice questions built around the active 2026 curriculum to streamline your daily revision.
Verified Solutions for Class 12 Biology
Built using official NCERT guidelines for Class 12 Biology, these materials provide reliable academic support. Integrating past examination questions and step-by-step solutions helps students understand official CBSE grading criteria.
Enhance Accuracy with Online Tests
Wrap up your chapter revision by testing your knowledge against standard objective question formats. Explore our full library of free, up-to-date sample papers and online assessments to secure top grades in your CBSE examinations.
FAQs
Our advanced study package for Chapter 13 Biodiversity and Conservation includes detailed concepts, diagrams, Mind Maps, and explanation of complex topics to ensure Class 12 students learn as per syllabus for 2026 exams.
The Mind Maps provided for Chapter 13 Biodiversity and Conservation act as visual anchors which will help faster recall during high-pressure exams.
Yes, teachers use our Class 12 Biology resources for lesson planning as they are in simple language and have lot of solved examples.
Yes, You can download the complete, mobile-friendly PDF of the Biology Chapter 13 Biodiversity and Conservation advanced resources for free.
Yes, our subject matter experts have updated the Chapter 13 Biodiversity and Conservation material to align with the rationalized NCERT textbooks and have removed deleted topics and added new competency-based questions.