

Class 12 Biology Study Guide: CBSE Class 12 Biology Bio Technology and Its Application Diagrams
Review targeted academic resources with the CBSE Class 12 Biology Bio Technology and Its Application Diagrams. Built according to official CBSE standards for the 2026-27 term, these downloadable Class 12 Biology study materials support effective daily practice and deeper conceptual understanding for Chapter 10 Biotechnology and Its Application.
Download Chapter 10 Biotechnology and Its Application Study Material PDF
Navigate directly to the advanced Biology study materials using the digital viewer below. Each resource pack includes detailed conceptual summaries and solved practice questions, allowing students to instantly reinforce their learning.
CBSE Class 12 Biology Bio Technology and Its Application Diagrams. Please refer to the examination notes which you can use for preparing and revising for exams. These notes will help you to revise the concepts quickly and get good marks.
BIO TECHNOLOGY AND ITS APPLICATION
BIOLOGY
CHAPTER - 12 BIOTECHNOLOGY & ITS APPLICATIONS
1. MATURATION OF PROINSULIN INTO INSULIN [3 Marks]
[Figure: Schematic diagram showing maturation of proinsulin into insulin containing Proinsulin polypeptide with A, B, and C peptides, removal of C peptide, and formation of mature insulin consisting of A peptide and B peptide linked by disulfide bonds, along with free C peptide]
Answer:
1. Proinsulin consists of three chains: A peptide, B peptide, and an extra stretch called the C peptide.
2. The C peptide is removed during maturation to convert proinsulin into functional insulin.
3. Mature insulin consists of two short polypeptide chains, A and B, that are linked together by disulfide bridges.
Teacher's Note:
a) Proinsulin is inactive because of the presence of the extra C peptide.
b) Recombinant DNA technology successfully bypassed this maturation problem by producing chains A and B separately and linking them.
c) This diagram is frequently asked to test the structural difference between mammalian proinsulin and active human insulin.
CHAPTER - 13 ORGANISMS & POPULATIONS
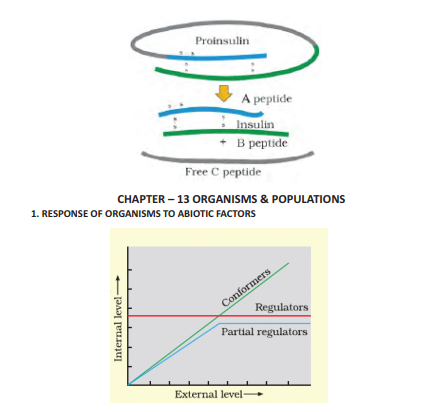
1. RESPONSE OF ORGANISMS TO ABIOTIC FACTORS [3 Marks]
[Figure: Graph showing the response of organisms to abiotic factors with External level on the x-axis and Internal level on the y-axis, illustrating three types of responses: Regulators (horizontal straight line), Conformers (diagonal upward sloping line), and Partial regulators (line that initially conforms and then flattens out as a regulator)]
Answer:
1. Regulators maintain a constant internal environment despite varying external environmental conditions.
2. Conformers cannot maintain a constant internal environment; their body internal environment changes with the external abiotic conditions.
3. Partial regulators are organisms that can regulate their body temperature or osmotic concentration up to a certain level of environmental change beyond which they behave as conformers.
Teacher's Note:
a) Thermoregulation and osmoregulation are the primary physiological mechanisms depicted by regulators.
b) A vast majority of animals (99 percent) and nearly all plants are conformers because maintaining homeostasis is energetically expensive.
c) Birds and mammals are successful regulators capable of maintaining constant body temperature regardless of external extremes.
2. REPRESENTATION OF AGE PYRAMIDS FOR HUMAN POPULATION [3 Marks]
[Figure: Bar graphs representing age pyramids for human population categorized into Pre-reproductive, Reproductive, and Post-reproductive age groups, showing three distinct shapes labeled Expanding (triangular pyramid with wide base), Stable (bell-shaped pyramid), and Declining (urn-shaped pyramid with narrow base)]
Answer:
1. Expanding population pyramid has a very large base representing a high proportion of pre-reproductive individuals.
2. Stable population pyramid shows an even distribution where pre-reproductive and reproductive individuals are almost equal in number.
3. Declining population pyramid has a constricted base indicating fewer pre-reproductive individuals compared to reproductive individuals.
Teacher's Note:
a) Age pyramids reflect the growth status of a population at any given time.
b) The shape of the pyramid tells whether a population is growing, stable, or declining.
c) Pre-reproductive, reproductive, and post-reproductive are the three main ecological age groups used in demographic studies.
3. FACTORS AFFECTING POPULATION DENSITY [2 Marks]
[Figure: Flowchart showing factors affecting population density (N) with four components: Natality (B) and Immigration (I) having a positive effect (+) increasing density, and Mortality (D) and Emigration (E) having a negative effect (-) decreasing density.]
Answer:
1. Natality (B) and Immigration (I) increase population density.
2. Mortality (D) and Emigration (E) decrease population density.
Teacher's Note:
a) Natality refers to the number of births, while immigration is the number of individuals entering the habitat.
b) Mortality represents deaths, and emigration represents individuals leaving the habitat.
CHAPTER - 14 ECOSYSTEM
1. FLOW OF ENERGY THROUGH A FOOD CHAIN [3 Marks]
[Figure: Diagram illustrating the unidirectional flow of energy through a food chain starting from the Sun, passing through producers (plants) as the first trophic level, primary consumers (herbivores) as the second trophic level, secondary consumers (carnivores) as the third trophic level, and tertiary consumers (top carnivores) as the fourth trophic level, with heat loss indicated at each trophic level.]
Answer:
1. Energy flows unidirectionally from the sun to producers and subsequently to various trophic levels of consumers.
2. According to the ten percent law, only about 10 percent of energy is transferred from one trophic level to the next.
3. A major part of energy is lost as heat to the environment at each trophic level during metabolic activities.
Teacher's Note:
a) Ecosystem energy flow is governed by the first and second laws of thermodynamics.
b) The unidirectional flow prevents energy from cycling back to the sun.
c) Trophic levels are restricted in number due to progressive energy loss.
1. Study the diagrams given below showing different types of ecological pyramids and answer the questions that follow: [5 Marks]
[Figure: Four ecological pyramids labeled as A. Pyramid of number showing Trophic levels PP (Primary producer) = 5,842,000, PC (Primary consumer) = 708,000, SC (Secondary consumer) = 3,54,000, TC (Tertiary consumer) = 3; B. Pyramid of Biomass showing energy values TC = 10 J, SC = 100 J, PC = 1000 J, PP = 10,000 J with 1,000,000 J of Sunlight; C. Inverted Pyramid of Biomass showing PC = 21 and PP = 4; D. An ideal Pyramid of Energy showing Trophic levels TC = 1.5, SC = 11, PC = 37, PP = 809 in dry weight (kg m\(^{-2}\))]
Answer:
1. Pyramid A represents an upright pyramid of number in a grassland ecosystem where the number of producers is maximum and decreases towards higher trophic levels.
2. Pyramid B represents the flow of energy and biomass reduction across trophic levels, showing that only 10 percent of energy is transferred to the next trophic level.
3. Pyramid C represents an inverted pyramid of biomass, commonly observed in aquatic ecosystems where small standing crop of phytoplankton supports a larger standing crop of zooplankton.
4. Pyramid D represents an ideal pyramid of energy, which is always upright because energy is lost as heat at each step during transfer between trophic levels.
5. Ecological pyramids help in understanding the trophic structure and functional role of organisms in an ecosystem.
Teacher's Note:
a) Ecological pyramids represent graphical representations of trophic structure and function in aquatic and terrestrial ecosystems.
b) Students often confuse inverted pyramids of biomass with energy pyramids, which are strictly always upright.
c) The 10 percent law of energy transfer governs the diminishing energy values observed at successive trophic levels.
d) Mentioning specific ecosystem examples like aquatic or grassland adds high value in board evaluations.
Free study material for Biology
CBSE Class 12 Biology Study Material: Chapter 10 Biotechnology and Its Application
Comprehensive Study Resources for Chapter 10 Biotechnology and Its Application
Review targeted study resources for Chapter 10 Biotechnology and Its Application tailored for Class 12 learners. Utilizing these structured notes and quick-revision tools ensures complete alignment with current CBSE evaluation standards.
Understanding Marking Schemes
Built using official NCERT guidelines for Class 12 Biology, these materials provide reliable academic support. Integrating past examination questions and step-by-step solutions helps students understand official CBSE grading criteria.
Complete Revision for Biology
For peak performance in upcoming evaluations, integrate official Biology sample papers directly into your study schedule. Follow up your revision by attempting online MCQ tests for Chapter 10 Biotechnology and Its Application to refine calculation speed and precision.
FAQs
Our advanced study package for Chapter 10 Biotechnology and Its Application includes detailed concepts, diagrams, Mind Maps, and explanation of complex topics to ensure Class 12 students learn as per syllabus for 2026 exams.
The Mind Maps provided for Chapter 10 Biotechnology and Its Application act as visual anchors which will help faster recall during high-pressure exams.
Yes, teachers use our Class 12 Biology resources for lesson planning as they are in simple language and have lot of solved examples.
Yes, You can download the complete, mobile-friendly PDF of the Biology Chapter 10 Biotechnology and Its Application advanced resources for free.
Yes, our subject matter experts have updated the Chapter 10 Biotechnology and Its Application material to align with the rationalized NCERT textbooks and have removed deleted topics and added new competency-based questions.