
Get the most accurate NCERT Solutions for Class 9 Computer Science MS Excel 2007 here. Updated for the 2026-27 academic session, these solutions are based on the latest NCERT textbooks for Class 9 Computer Science. Our expert-created answers for Class 9 Computer Science are available for free download in PDF format.
Detailed MS Excel 2007 NCERT Solutions for Class 9 Computer Science
For Class 9 students, solving NCERT textbook questions is the most effective way to build a strong conceptual foundation. Our Class 9 Computer Science solutions follow a detailed, step-by-step approach to ensure you understand the logic behind every answer. Practicing these MS Excel 2007 solutions will improve your exam performance.
Class 9 Computer Science MS Excel 2007 NCERT Solutions PDF
Question : Define the term workbook.
Answer: A workbook is a collection of worksheets. By default, there are three worksheets in every workbook.
Question : Reena is new to Excel. Her instructor has asked her to open Excel on her PC and questioned about active cell. Help Reena in identifying the active cell on her screen.
Answer: An active cell is a cell with heavy black color boundary.
Question : What is the default alignment of number, text and formula in a spreadsheet?
Answer: Default alignment of text or label entry is left alignment and for numbers and formula it is right alignment.
Question : Elaborate the formatting necessary.
Answer: With formatting, we can make some data to be bolder, rotated or in different color. So, basically formatting provides worksheet a neater and more legible outlook.
Question : Soham has clicked on the cell residing at the intersection of first row and ninth column.What will be the address of the selected cell?
Answer: First row and ninth column address will be II.
Question : How many ways are there for adding a new worksheet in an Excel workbook?
Answer: There are two methods of adding a new worksheet in an Excel workbook; Insert worksheet tab at the bor >m and Insert button on cells group under Home tab.
Question : In Excel, how many ways are there to express/format a number?
Answer: Numbers in Excel can be expressed in many different formats like date, time, percentage or decimals.
Question : Name the toolbar of spreadsheet which has all the options of changing the font properties.
Answer: Formatting Toolbar
Question : What do you mean by relative referencing?
Answer: Cell referencing in which the cells are referred by their relative position in the worksheet relative to a particular cell is called relative referencing.
Question : How many cells would be there in the cell range [A1 ; B2]?
Answer: There would be 4 cells in the given cell range.
Question : The cell A1 has value Monday. If you are asked to click and drag the Fill handle of A1 downside then what will be the contents of cell A2, A3, A4 and A5?
Answer: Cells A2, A3, A4 and A5 will contain Tuesday, Wednesday, Thursday and Friday respectively.
Question : If = 6 -5 *2 is entered in a cell, then what will be the cell content?
Answer: -4 will be contained in cell as a result.
Question : In a spreadsheet software, the formula =A1 +$A$2 was entered in cell A3 and then copied into cell B3. What is the formula copied into B3?
Answer: =B1+$A$2 will be copied into B3.
Question : Write down the formula for adding values of cells A1 to A5.
Answer: Formula for adding values of cells A1 to A5 would be =SUM(A1 : A5).
Question : State difference between COUNT() and COUNTA() function.
Answer: The only difference between the COUNT() and COUNTA() function is that the COUNTA() function computes the numbers as well as text
entries, while the COUNT() function counts only numbers.
Question : Hansika wants to apply MIN function on a cell range, but all the values in that range are of Boolean. What value will be returned by the MIN function?
Answer: MIN function will return O(zero) in this case.
Question : Why we cannot add titles to an embedded chart once chart is ready?
Answer: Titles have not been entered in chart elements step. And, these cannot be added later once chart is ready.
Question : Write down the importance of legend in charts.
Answer: With the help of legend, each data series can be uniquely identified by assigning a unique color or pattern.
Question : What will be the column names of the below statement?
1. 26th column
2. 28th column
Answer:
1. Z
2. AB
Short Answer Type Questions
Question : What is the difference between a workbook and a worksheet?
Answer: Differences between workbook and worksheet are as follows:
Workbook Worksheet
A workbook is an Excel file with one A worksheet is a single spreadsheet of
or more worksheets. data.
A workbook would be the entire A worksheet would be like one section in
binder, with everything in it. that binder.
Question : Write down the significance of electronic spreadsheets.
Answer: Using electronic spreadsheets, large volume of data can be stored in worksheets.Worksheets can be managed, edited, viewed, retrieved and printed easily in desired format.Electronic spreadsheets support charts, which represent data pictorically.
Question : Is it possible to remove a worksheet? State the process of doing it.
Answer: Yes, it is possible to remove a worksheet. To remove a worksheet right-click on the Sheets tab of the sheet that you want to delete and choose Delete from pop-up menu, or choose Delete Sheet from the pop-up menu of Delete option on cells group under Home tab.
Question : Define the meaning of formula.
Answer: Formula plays a major role in spreadsheet making. If we all needed to do is to put text and numbers in rows and columns, just about any Word processing program would fill the bill.Formula allows us to perform calculations using values from any cells to have the result appear in the formula cell.
Question : Suggest the appropriate functions for the following situations:
1. For returning the minimum value out of a range A1 to C5.
2. For determining whether the customer is eligible for discount or not from the bill amount stored in cell D5. A customer is eligible for discount if bill amount >5,000.
Answer:
1. = MIN(A1 : C5)
2. = IF(D5>5,000, “Discount”, “NoDiscount”)
Question : Suggest the appropriate function for the following situations:
1. Selecting the maximum value out of a range A1 to B20.
2. Calculating average of marks entered in cells E5, F5, G5, H5 and 15.
3. Determining whether the student has passed (if scored > = 40) or not from the marks stored in cell J10.
Answer:
1. = MAX(A1 : B20)
2. = AVG(E5:15)
3. =IF(J10 >= 40, “Pass”, “Fail”)
Question : Sana has entered 49+30 in a cell. The worksheet is not displaying 79 in the cell. Instead,49+30 is getting displayed. Help, Sana in rectifying the problem.
Answer: In Excel, every formula must start with an = (equal) sign.
Since, Sana has not put = sign before 49+30, thus she is not able to see the desired result will be displayed if she will use = (49 + 30) formula.
Question : What is the use of the COUNT() function in Excel?
Answer: Excel’s COUNT() function can be used to total the number of cells in a selected range. The COUNT() function will add up the number of cells in a selected range that contains numbers.
Question : For what purpose pie charts are useful?
Answer: Pie charts are useful for the following purposes:
1. They convey approximate propositional relationship at a point in time.
2. They compare part of a whole at a given point in time.
3. Exploded portion of a pie chart emphasize a small proportion of parts.
Long Answer Type Questions
Question : Explain the concept of cell referencing alongwith its various types.
Answer: Excel supports three types of cell referencing, which are as follows:
1. Relative Every relative cell reference in formula automatically changes when the formula is copied down a column or across a row. As the example illustrated hereshows, when the formula is entered (= B4 — C4) in Cell D4 then this formula copied in D5 then it will change into (= B5 — C5) related to cell.
2. Absolute An absolute cell reference is fixed. Absolute references do not change if you copy a formula from one cell to another. Absolute references have dollar sign ($) like $S$9. As the shows, when the formula =C4*$D$9 is copied from row, the absolute cell reference remains as $D$9. ‘
3. Mixed A mixed cell reference has either an absolute column and a relative row, or an absolute row and a relative column, e.g. $A1 is an absolute reference to column A and a relative reference to row 1. As a mixed reference is copied from one cell to another, the absolute reference stays the same but the relative reference changes.
Question : Explain any five functions that can be used in a worksheet.
Answer:
1. SUM Function
This function, as clear from name, is used to add all the values provided as argument and to display the result in the cell containing function.
Argument Type All Numbers Return Type Number Syntax = SUM(numberl, number2, )
e.g. if you want to display the sum of values of cells Al, A2, A5 and A6 in cell A9, then you need to simply type = SUM(A1,A2,A5,A6) in cell A9 and press Enter.
The sum will be displayed in cell A9. If you want to add a range of values, then provide that range in SUM function as an argument. e.g. if you want to add values from Al to A5, then write like =SUM(A1:A5).
- If an argument is an array or reference, only numbers in that array or reference are counted. Empty cells, logical values or text in the array or reference are ignored.
- If any arguments are error values or if any arguments are text that cannot be translated into numbers, Excel displays an error.
2. AVERAGE Function
This function calculates the average of all the values provided as argument to this function.
Argument Type All Numbers Return Type Number
Syntax = AVERAGE(number1, number2, )
e.g. to calculate the average of the values of range starting from Al to A5 in cell B9, you need to write = AVERAGE(A1:A5) in cell B9.
3. COUNT Function
This function counts the number of cells that contain numbers and numbers within the list of arguments. Argument Type Any Type Return Type Number
Syntax = COUNT(value1, value2, )
e.g. if the values contained in cells Al, A2, A3 and A4 are 5, 7, TRUE and 10 respectively, then – COUNT(Al:A4) will return 3.
Arguments that are numbers, dates or text representation of numbers (e.g. a number enclosed in quotation marks, such as ‘1’) are counted.
- Arguments that are error values or text that cannot be translated into numbers are not counted.
- If an argument is an array or reference, only numbers in that array or reference are counted. Empty cells, logical values, text or error values in the array or reference are not counted.
4. COUNTA Function
This function is similar to the COUNT( ) function. The only difference is that the COUNTA() function also calculates the text entries even when the entries contain an empty string of
length 0(zero), i.e. “ ’ ”, but empty cells are ignored. The COUNTA() function counts the total number of values in the list of arguments.
Argument Type Any Type Return Type Number Syntax = COUNTA (number 1, number 2, …)
e.g. if the value contained in cells Al, A2, A3 and A4 are 5, 7, TRUE and 10 respectively then = COUNTA (Al : A4) will return 4.
5. MAX Function
This function is used to return maximum value from a list of arguments.
Argument Type All Numbers Return Type Number
Syntax = MAX(number1, number2, ….)
e.g. if the values contained in cells Al, A2, A3 and A4 are 5, 7, 2 and 10 respectively then =
MAX(A1:A4) will return 10.
- MAX will consider only numeric and logical values to compute maximum. ifij
- If an argument is an array or reference, only numbers in that array or reference are used. Empty cells or text in the array or reference are ignored.
- If the arguments contain no numbers, MAX returns 0 (zero).
- Arguments that are error values or text that cannot be translated into numbers cause errors.
Question : Write down the name and purpose of various components of a chart.
Answer: Various components or parts of chart are as follows:
1. X-axis Refers to a horizontal axis, which is also known as category axis.
2. Y-axis Refers to a vertical axis also known as value axis.
3. X-axis title Conveys the full details of the X-axis values.
4. Y-axis title Conveys the full details of the Y-axis values.
5. Data series Refers to a set of data that you want to display in a chart.
6. Chart area Refers to the total space that is enclosed by a chart.
7. Plot area Refers to the main region of the chart in which your data is plotted.
8. Chart title Denotes the type of data plotted in a chart.
9. Legend In a chart showing different data series, a unique color or pattern is assigned
to each data series. This unique color of pattern is known as a legend.
10. Gridlines These are the horizontal and vertical lines within the plot area in a chart.
11. Data label Provides additional information about a value in the chart, that is coming from a worksheet cell.
Question : What are the various types of charts? Explain each.
Answer: The various types of charts in Excel are given below: Line Chart: Data that is arranged in columns or rows on a worksheet can be plotted in a line chart. Line charts can display continuous data over time, set against a common scale and are therefore ideal for showing trends in data at equal intervals. In a line chart, category data is distributed evenly along the horizontal axis and all value data is distributed evenly along the vertical axis.
Pie Chart: Data that is arranged in one column or row only on a worksheet can be plotted in a pie chart. Pie charts show the size of items in one data series, proportional to the sum of the items. The data points in a pie chart are displayed as a percentage of the whole pie. Scatter Chart: Data that is arranged in columns and rows on a worksheet can be plotted in an XY (scatter) chart. Scatter charts show the relationships among the numeric values in several data series, or plots two groups of numbers as one series of XY coordinates.
Bar Chart: Data that is arranged in columns or rows on a worksheet can be plotted in a bar chart. Bar charts illustrate comparisons among individual items.
Area Chart: Data that is arranged in columns or rows on a worksheet can be plotted in an area chart. Area charts emphasize the magnitude of change over time and can be used to draw attention to the total value across a trend, e.g. data that represents profit over time can be plotted in an area chart to emphasize the total profit.
Question : How are charts created in Excel? Write the steps.
Answer: Creating a Chart:
Here is a worksheet that shows the marks of students in a class subject wise. To create a chart, do the following:
1. Select the data that you want to show, including the column titles and the row labels.
2. Then click the Insert tab and in the Charts group, click the Column button. You could select another chart type, but column charts are commonly used to compare items.
3. After you click Column, you’ll see a number of column chart types to choose from.
Click Clustered Column, the first column chart in the 2-D Column list.
A ScreenTip displays the chart type name, when you rest the pointer over any chart type.
The ScreenTip also provides a description of the chart type and gives you information about that, when to use each one.
If you want to change the chart type after you create your chart, click inside the chart. On the Design tab under Chart Tools, in the Type group, click Change Chart Type and select another chart type.
Question : In a worksheet, cell K12 has a value. A formula is to be entered in cell K15, such that if the value in cell K12 is more than 300, the value in cell K15 would be 1.33 times the value of cell K12. Otherwise, the value in cell K15 would be 1.5 times the value in cell K12. Explain the formula that you use to achieve this.
Answer: In cell K15, enter the conditional statement as: = IF (K12 > 300, K12 *1.33, K12 * 1.5). Here, IF condition checks the value at K12, that is, if it is greater than 300, then calculate 1.33 of K12, otherwise 1.5 of K12.
Question : Describe, how the owner of the restaurant could use the spreadsheet for financial modeling?
Answer:
1. Decide on a total purchasing need for next night/week/month/year.
2. Change figures in spreadsheet.
3. Raise/lower/add/delete any value.
4. Compare results with predicted/total needed/target results.
5. To general use for budgeting like to calculate profit.
Question : Write command for the operations (i) to (iii) based on the spreadsheet below:
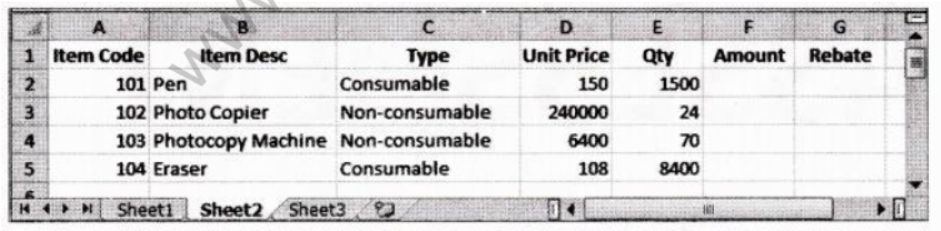
1. To calculate the Amount as Unit Price*Qty for each item in Column F.
2. To calculate the Rebate as 7% of Amount if Type is consumable, else calculate Rebate as 11% of Amount in Column G.
3. To calculate total Rebate across all items in cell G6.
Answer:
1. At cell F2, type =D2*E2 and then copy this formula using mouse Fill handle onto range F3 : F5.
2. At cell G2, type =IF(C2=”Consumable”, F2*0.07, F2*0.11) and then copy this formula using mouse Fill handle onto range G3 : G5.
3. At cell G6, type =SUM(G2 : G5).
Question : Arihant stationery keeps stock of various stationeries in his shop. The proprietor wants to maintain a stock value and reorder level for following items as given in a spreadsheet. Write formulas for the operations (i) to (iii) and answer the questions (iv) and (v) based on the spreadsheet given below alongwith the relevant cell address:
1. To calculate the Stock Value as product of ‘Quantity in Stock1 and ‘Rate’ for each item present in the spreadsheet.
2. To calculate the ‘Quantity to Order’ as ‘Minimum Stock Quantity’-‘Quantity in Stock’ for each item.
3. To calculate the ‘Order Value’ as product of ‘Quantity to Order’ and ‘Rate’ for the items if ‘Quantity to Order’>=0, else assign the value as 0.
4. Proprietor wants to graphically represent his stationery stock. Suggest him the most appropriate feature of MS-Excel.
5. If Quantity in Stock’s value changes, will have to redo all the calculations for that particular column? Explain.
Answer:
1. At cell F2, type = D2*E2 and then copy this formula using Fill handle in range F3 : F5.
2. At cell G2, type = C2 – D2 and then copy this formula using Fill handle in range G3 : G5.
3. At cell H2, type = IF (G2 > = 0, G2*E2, 0) and copy this formula using Fill handle in the range H3 : H5.
4. He should create chart of any type to graphically represent his data.
5. No the recalculation is not again required because the formula and functions that are given changes according to the values in the cells.
Question : Neha Mittal wants to store data of her monthly expenditure for a period of two year and also wants to perform some calculation and analysis. Which Microsoft application, will you suggest Neha should use for this purpose and why?
Answer: Microsoft Excel should be used because it cannot only be used for storing data, but also be used to perform calculations and analysis of the data.
Multiple Choice Questions
Question : A worksheet is a ……………….
(a) collection of workbooks
(b) processing software
(c) combination of rows and columns
(d) None of the above
Answer: (c)
Question : By default, a workbook in Excel contains how many worksheets?
(a) 16
(b) 3
(c) 15
(d) 256
Answer: (b)
Question : The simplest way to move data from one location to another in Excel is ………………
(a) by Quick Access toolbar
(b) using Cut and Paste
(c) by the drag and drop method
(d) Both (b) and (c)
Answer: (d)
Question : The AutoFill can apply from
(a) left to right
(b) right to left
(c) up to down
(d) All of these
Answer: (d)
Question : The default page orientation in Excel is
(a) Landscape
(b) Horizontal
(c) Portrait
(d) None of these
Answer: (c)
Question : Word wrapping means
(a) the text remains in the straight line
(b) the text distributed in multiple lines
(c) displays text vertically within a cell
(d) displays the selected text in a different font style
Answer: (b)
Question : A term that is used in spreadsheet which forces a line break in a cell when the cell entry is too large to fit in the cell.
(a) Wrap
(b) Line Break
(c) Cell Break
(d) Multiline Cell
Answer: (a)
Question : The default alignment of text in a cell is
(a) Left
(b) Right
(c) Centered
(d) Justified
Answer: (a)
Question : Absolute cell referencing occurs when ……………
(a) formula is dragged but the cell references do not adjust.
(b) spreadsheet is saved with “absolute” as file name.
(c) formula is dragged and the cell reference adjusts automatically.
(d) $ symbol is automatically added with each cell value.
Answer: (a)
Question : Find out the odd one
(a) Absolute
(b) Relative
(c) Mixed
(d) AutoFill
Answer: (d)
Question : Cell address $B$5 in a formula means
(a) it is a mixed reference
(b) it is an absolute reference
(c) it is a relative reference
(d) None of the above
Answer: (b)
Question : While entering a formula, cell address B$5 represents
(a) Absolute Referencing
(b) Mixed Referencing
(c) Relative Referencing
(d) All of these
Answer: (b)
Question : A cell range starting from first row, first column to fourth row and fifth column can be represented as
(a) [A1 : E4]
(b) [AO : E3]
(c) [E4 : Al]
(d) [E3 : AO]
Answer: (a)
Question : A cell range always has the symbol between the cell references.
(a) ; (semicolon)
(b) . (full stop)
(c) .(comma)
(d) :(colon)
Answer: (d)
Question : If cell range A1 : A5 contain the numbers 20, 16, 5, 35 and 7 then = AVERAGE(A1 : A5, 50) will display.
(a) 22.167
(b) 27.167
(c) 10
(d) 40
Answer: (a)
Question : COUNTA (4, 78, False, 18) will return ……………….
(a) 2
(b) 3
(c) 4
(d) 5
Answer: (c)
Question : If you type =2 * (6-4) in cell Al, what value will be display?
(a) 2
(b) 4
(c) 6
(d) 8
Answer: (b)
Question : You can place the chart legend in the chart at ……………..
(a) Bottom
(b) Corner
(c) Top, Right and Left
(d) All of these
Answer: (d)
Question : In Excel chart, text displayed at data points to indicate the specific category is called……………..
(a) data point
(b) data series
(c) data label
(d) legends
Answer: (c)
Question : You have used a spreadsheet to calculate the average marks of a class in Mathematics.
Which input is essential to find the average marks?
(a) Marks of each student of class in Science
(b) Marks of each student of class in Mathematics
(c) Average marks in Mathematics of each student of class
(d) Names and roll numbers of each student of class
Answer: (b)
Question : A chart is created on the basis of values in ………………
(a) mail merge
(b) database
(c) spreadsheet
(d) document
Answer: (c)
Question : Which of the following charts is used for comparing the changes in data over a period of time?
(a) Bar chart
(b) Area chart
(c) Scatter chart
(d) Line chart
Answer: (d)
Question : Which of the following chart selects only one range of the data series?
(a) Line chart
(b) Pie chart
(c) Scatter Chart
(d) Bar chart
Answer: (b)
Question : The another name for the XY chart is ……………….
(a) Column chart
(b) Net chart
(c) Bar chart
(d) Scatter chart
Answer: (d)
Question : Which of the following shortcut keys brings the cursor to the last cell on the sheet that contains data?
(a) Ctrl+Home
(b) Ctrl+End
(b) Ctrl + Page down
(d) Ctrl+down arrow
Answer: (b)
Question : For selecting a non-continuous range of cells, you need to do what?
(a) Press Alt key
(b) Press Shift key
(c) Press Esc key
(d) Press Ctrl key
Answer: (b)
Question : For selecting the entire worksheet in Excel, you need to press ……………….
(a) Alt + Shift +eSpacebar
(b) Ctrl + Shift + Spacebar
(c) Shift + Spacebar
(d) None of the above
Answer: (b)
Question : The sample of an Excel worksheet on the screen can be seen by ………………..
(a) Print preview
(b) Print
(c) Review
d) None of the above
Answer: (a)
Fill in the Blanks
Question : Excel is a ………………. software package.
Answer: spreadsheet
Question : When you …………. or ……………. , the selected range gets surrounded by a moving border.
Answer: copy, cut
Question : The ………….. and …………… operations copies data from source range to target range and erases it from the source range.
Answer: cut, paste
Question : Address of the cell at 10th column and 30th row is ………………
Answer: J30
Question : The cell having bold boundary is the ……………..
Answer: active cell
Question : Any formula in Excel starts with an ……………..
Answer: equal (=) sign
Question : The keyboard shortcut for copy is ……………. and for paste is ………………..
Answer: Ctrl + C, Ctrl + V
Question : In …………….. referencing, the relative address of the cell gets adjust with respect to the current cell.
Answer: relative
Question : For absolute referencing, ……………. sign is used before the parts of formula.
Answer: $
Question : If you enter 15 + 30 in a cell, Excel will display ……………..
Answer: 15 + 30
Question : To specify the number of decimal places in a cell the ……………… tab of the Format cells dialog is used.
Answer: Fill series
Question : The ……………. tool is used in spreadsheet that creates a growth series, wherein subsequent values follow an increasing or a decreasing geometric pattern.
Answer: Source
Question : The range of cells containing data that makes a chart is termed as ……………… data.
Answer: Numbers
Question : …………. are text, number cell references enclosed within parenthesis in a formula.
Answer: Arguments
True or False
Question : You cannot open two different workbooks in Excel simultaneously.
Answer: False You can open two different workbooks in Excel simultaneously.
Question : When a cell containing a formula is moved, the cells referring the moved cell show an error value.
Answer: False When a cell containing a formula is moved, the cells referring the moved cell does not show an error value.
Question : A cell entry can be edited either in the cell or in the formula bar.
Answer: True There are two ways to edit the data which has entered in the cell, i.e. in the cell or in the formula bar.
Question : If the data entered in a cell is 546Z then, Excel will treat it as a number because it starts with a digit.
Answer: False It will be treated as non-numeric data because it contains letters alongwith numbers.
Question : We cannot enter the date/time in a cell.
Answer: False Date/time can be added to an Excel cell.
Question : The Fill handle tool is used for labour intensive entering data in a spreadsheet.
Answer: True Entering data into a spreadsheet can be very labour intensive, but Fill handle tool autofill the entries and save time.
Question : The Insert button is found on Cells group under Home tab.
Answer: True Insert button is available on Cells group under Home tab and is used to insert cells, rows and columns.
Question : The title of the chart tells the type of the chart.
Answer: False The title of chart tells the name of the chart.
Question : A chart is a graphical representation of worksheet data.
Answer: True A chart is a graphical representation of worksheet data.
Question : The contents of a cell can be changed by pressing F2 key on keyboard.
Answer: True F2 is a shortcut for making cell editable
NCERT Solutions Class 9 Computer Science MS Excel 2007
Students can now access the NCERT Solutions for MS Excel 2007 prepared by teachers on our website. These solutions cover all questions in exercise in your Class 9 Computer Science textbook. Each answer is updated based on the current academic session as per the latest NCERT syllabus.
Detailed Explanations for MS Excel 2007
Our expert teachers have provided step-by-step explanations for all the difficult questions in the Class 9 Computer Science chapter. Along with the final answers, we have also explained the concept behind it to help you build stronger understanding of each topic. This will be really helpful for Class 9 students who want to understand both theoretical and practical questions. By studying these NCERT Questions and Answers your basic concepts will improve a lot.
Benefits of using Computer Science Class 9 Solved Papers
Using our Computer Science solutions regularly students will be able to improve their logical thinking and problem-solving speed. These Class 9 solutions are a guide for self-study and homework assistance. Along with the chapter-wise solutions, you should also refer to our Revision Notes and Sample Papers for MS Excel 2007 to get a complete preparation experience.
FAQs
The complete and updated is available for free on StudiesToday.com. These solutions for Class 9 Computer Science are as per latest NCERT curriculum.
Yes, our experts have revised the as per 2026 exam pattern. All textbook exercises have been solved and have added explanation about how the Computer Science concepts are applied in case-study and assertion-reasoning questions.
Toppers recommend using NCERT language because NCERT marking schemes are strictly based on textbook definitions. Our will help students to get full marks in the theory paper.
Yes, we provide bilingual support for Class 9 Computer Science. You can access in both English and Hindi medium.
Yes, you can download the entire in printable PDF format for offline study on any device.