
Get the most accurate NCERT Solutions for Class 5 Mathematics Chapter 12 Smart Charts here. Updated for the 2026-27 academic session, these solutions are based on the latest NCERT textbooks for Class 5 Mathematics. Our expert-created answers for Class 5 Mathematics are available for free download in PDF format.
Detailed Chapter 12 Smart Charts NCERT Solutions for Class 5 Mathematics
For Class 5 students, solving NCERT textbook questions is the most effective way to build a strong conceptual foundation. Our Class 5 Mathematics solutions follow a detailed, step-by-step approach to ensure you understand the logic behind every answer. Practicing these Chapter 12 Smart Charts solutions will improve your exam performance.
Class 5 Mathematics Chapter 12 Smart Charts NCERT Solutions PDF
1. Yamini did a project ‘Animals and Birds’. She asked each child of her class about one favourite pet animal. She used tally marks to record each answer.
For example if someone said cat she put one line in front of cats. When

(a) Look at the tally marks and write the number for each animal in the table.
How many children in all did Yamini talk to?
Ans. (a) First of all complete the table:
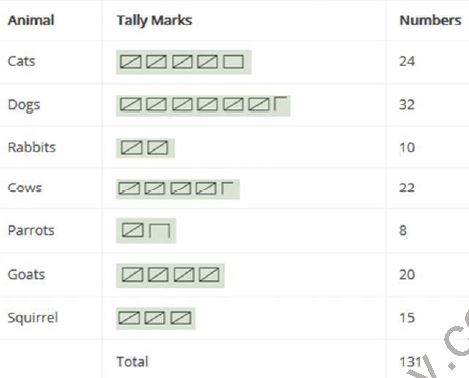
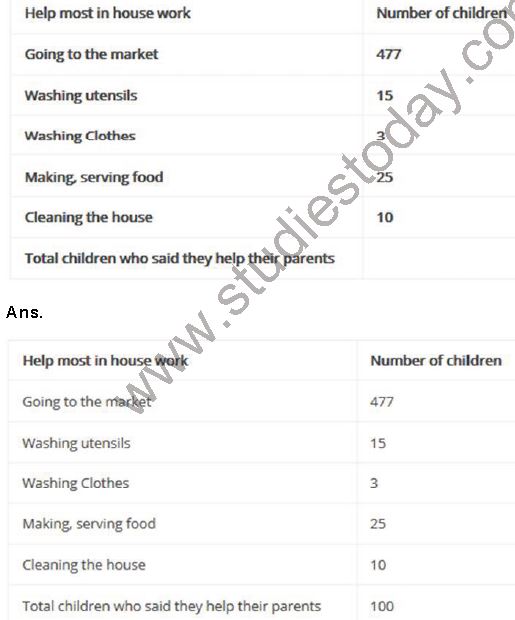
Yamini talked to 131 children in all.
(b) Which is the most favourite pet animal in this table?
Ans. (b) In this table the most favourite pet animal is dog.
(c) Which pet will you like to have? What will you name it? Which other animals can be kept at home? Discuss.
Ans. (c) The pet which I will take to have is dog. It will be named as BROWNY. The other animals which can be kept at home are horse, camel, buffalo, pigeon, sparrow, duck, cock, hen, fish, turtle etc.
2. Making Tally Marks on the Road Sumita stood on the road for half an hour and counted the number of vehicles passing by. She made a tally mark for each vehicle. This helped her in counting quickly the total number of vehicles in each group.
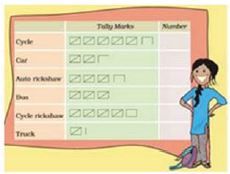
(a) Write the number of each vehicle in the table.
Ans. (a) Writing the number of each vehicle in the table.
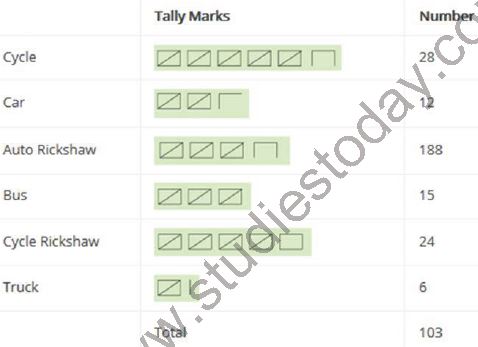
(b) How many vehicles in all did Sumita see on the road in half an hour.
Ans. (b) Number of vehicles seen by Sumiota in half an hour is 103.
(c) Auto Rickshaws are thrice the number of trucks – true/false?
Ans. (c) True.
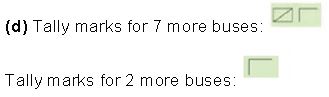
(d) Make tally marks for 7 more buses, and 2 more trucks.
Ans.
3. Helping Hands In the EVS period, the teacher asked children whether they help their parents at home. There were different answers. Children named the work in which they help their parents the most. The teacher collected their answers and made a table.
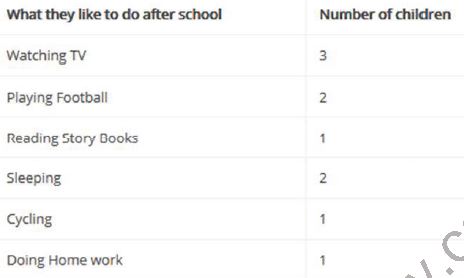
4. Ask 10 of your friends about what they like to do most after school.
Ans. On Collecting the answers given by my friends I tabulated information as under:
5. Ragini loves to watch cartoons on televisions. One day she thought for counting the number of ads during the breaks. She found that in each break there were 14 advertisements. In 10 of those ads there were children as actors.
(a) Why do you think that children are used in so many ads?
Ans. (a) Children are used in so many advertisement as the cartoons are mostly watched by the children.
(b) Use tally marks to count the number of ads during a short break in a programme. Were there ads during the news programme?
Ans. (b) Tally mark used to count the number of ads during a short break in a programme:
![]()
Yes, there were ads during the news programme.
6. Hot and Cold :
Have you seen the weather report on TV or in a newspaper? These are two bar charts. These show the highest temperature (in degrees Celsius) in four cities, on two different days. The cities are Delhi, Shimla, Bangalore and Jaisalmer.
Have you seen the weather report on TV or in a newspaper? These are two bar charts. These show the highest temperature (in degrees Celsius) in four cities, on two different days. The cities are Delhi, Shimla, Bangalore and Jaisalmer. '
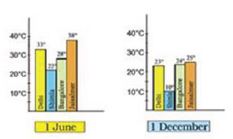
Find out from the bar charts-
(a) Which city is the hottest on 1 June?
Ans. (a) Jaisalmer is the hottest on 1 June.
(b) Which city is the coldest on 1 December?
Ans. (b) Shimla is the coldest on 1 December.
(c) Which city shows little change in temperature on the two days- 1 June and 1 December?
Ans. (c) Bangalore shows little change in temperature on the two days – 1 June and 1 December.
7. Rabbits in Australia:
Earlier there were no rabbits in Australia. Rabbits were brought to Australia around the year 1780. At that time there were no animals in Australia which ate rabbits. So the rabbits began to multiply at a very fast rate. Imagine what they did to the crops! The table shows how rabbits grew every year.
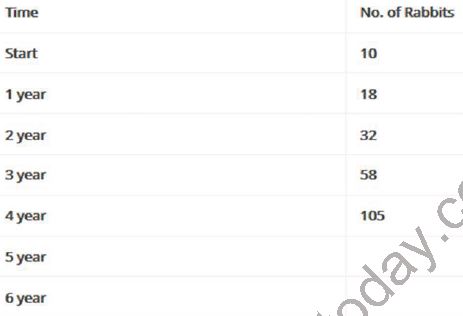
(a) After each year the number of rabbits was-
(1) a little less than double the number or rabbits in the last year.
(2) double the number in the last year.
(3) 8 more than the number of rabbits in the last year.
(4) more than double the number of rabbits in the last year.
Ans. (a) (1) a little less than double the number or rabbits in the last year.
(b) At the end of year 6, the number of rabbits cross 1000?
·400
·600
·800
Ans. (b) 400.
(c) After which year did the number of rabbits cross 100?
Ans. (c) In the year 1788, the number of rabbits cross 100.
8. Madhav’s mother helped him understand his family with the help of this drawing . You can also find out about your older generations using such a family tree.
(a) How many grandparents in all does Shobhna have?
Ans. (a) In all Shobhna has four grandparents.
(b) How many great great grandparents in all does Madhav have?
Ans. (b) Madhav has 8 great, great grand parents.
(c) How many elders will be in the VII generation of his family?
Ans. (c) There will be 32 elders in the VII generation of Madhav’s family.
(d) If he takes his family tree forward in which generation will he find 128 elders?
Ans. (d) 128 elders will be in IX generation of Madhav’s family tree.
9. Find out the growth chart
(a) Between which days did the length of the plant change the most?
(i) 0-4 (ii) 4-8 (iii) 8-12 (iv) 12-16 (v) 16-20
Ans. (iii) 8-12
(b) What could be the length of this plant on the 14 th day? Guess.
(i) 8.7cm
(ii) 9.9 cm
(iii) 10.2 cm
(iv) 10.5 cm
Ans. (ii) 9.9 cm
(c) Which plant keep growing all the time? What will be its length on the 100 th day? Make a guess.
Ans. The plant will not keep growing in the height all the time. I think it’s on the 100 th day may be 16.4 cm.
Question. As an activity on measurement, a group of students was asked to measure the capacity of a bucket. Each used a different sized measuring-mug to measure the capacity of the container, filling the mug completely every time. The result is shown in the table below: Who used the biggest mug?
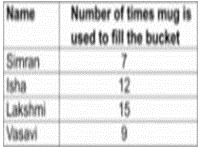
(a) Simran
(b) Laxmi
(c) Vasavi
(d) Isha
Answer : A
Question. What would Shankar be doing on a normal week day evening at the time shown by the clock below?
| Time | Activity |
| 3:35 pm | Walks home from school |
| 3:45 pm | Reaches home and has milk and snacks |
| 4:00 pm | Starts doing his homework |
| 5:40 pm | Goes out to play |
| 7:00 pm | Returns home and has a wash |
| 7:15 pm | Watches T.V |
| 8:00 pm | Has his dinner |
| 8:35 pm | Goes to bed |
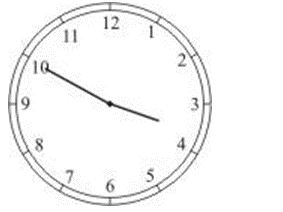
(a) Playing
(b) Doing his home work
(c) Having milk and snacks
(d) Walking back from school
Answer : C
Question. Who has exactly 200 cards more than Akshay?
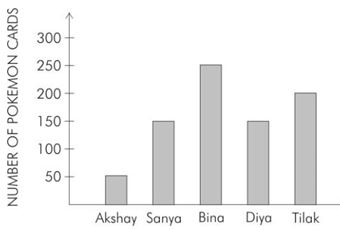
(a) BINA
(b) DIYA
(c) SANYA
(d) TILAK
Answer : A
Question. There were 48 students in a drawing class. The classroom had large tables, and 8 children sat at each table. The children on each table were given 3 crayon boxes to share.
In all, how many crayon boxes were given out for sharing?
(a) 18
(b) 24
(c) 54
(d) 144
Answer : A
Question. Bala is a student of class 5. What is he MOST likely to be doing at 12:10 AM on a Thursday?
(a) Playing cricket
(b) Having lunch
(c) Studying at school
(d) Sleeping
Answer : D
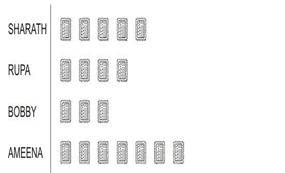
Question. Four children make a pictograph to show the number of stamps that each of them has collected. Sharath has 20 stamps more than Bobby. See the graph and answer the question. How many stamps does the symbol below stands for this pictograph?
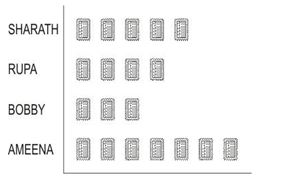
(a) 20
(b) 10
(c) 5
(d) 1
Answer : B
Question. Four children make a pictograph to show the number of stamps that each of them has collected. Sharath has 20 stamps more than Bobby. See the given graph and answer the question.
How many more stamps does Ameena need to have 100 stamps in her collection?
(a) 3
(b) 10
(c) 30
(d) 93
Answer : C
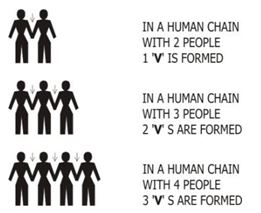
Question. When people hold hands to form 'human chains', their arms form 'V's like this: How many people would be needed to form a human chain like this so that 23 'V's are formed?
(a) 46
(b) 24
(c) 23
(d) 22
Answer : B
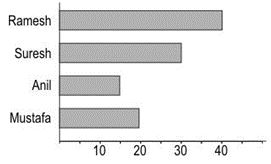
Question. Ramesh, Suresh, Anil and Mustafa are friends. They all collect toy cars. This graph shows how many toy cars each of them has. From this graph we can say:
(a) Anil has one-third the number of cars Ramesh has.
(b) Three children have more than 20 cars.
(c) Suresh has twice as many cars as Anil.
(d) Anil has 1 car less than Mustafa.
Answer : B
Question. How many trees does image represent?
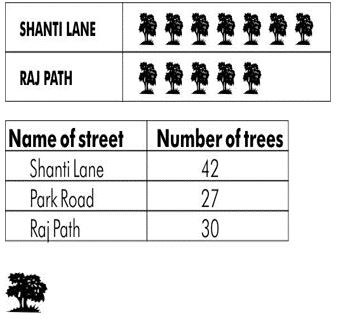
(a) 5
(b) 6
(c) 7
(d) 8
Answer : B
Question. Which of the following is the correct representation of the number of trees in Park Road?
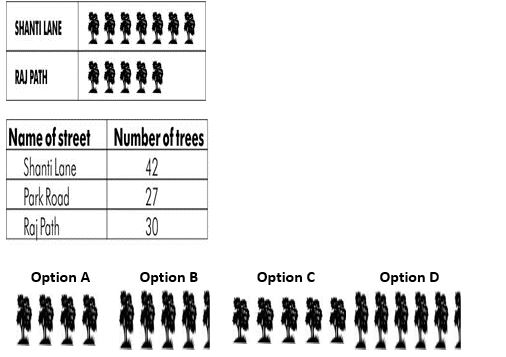
Answer : B
Question. Mahesh throws the dart TWICE at the board. Which of the following CAN be his total score from TWO THROWS? (Both throws hit the board.)
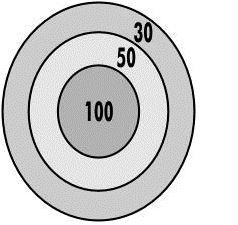
(a) 20
(b) 30
(c) 50
(d) 100
Answer : D
Question. What would be the MINIMUM number of throws needed to get a total score of 230 on this dartboard?
(a) 2
(b) 3
(c) 4
(d) 5
Answer : B
Question. In the figure shown here, how many crosses are in the triangle but not in the square?
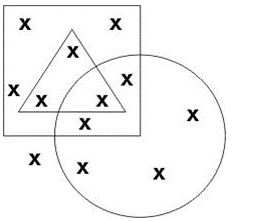
(a) 6
(b) 3
(c) 2
(d) 0
Answer : D
Question. The question is based on the bar graph given below.
Ms. Rane asks each student of her class the kind of T.V programme he or she likes the most. She puts down the result in the form of a bar graph shown below:

Question. According to the graph, more children like to watch Quiz programmes than Sports. How many more?
(a) 2
(b) 3
(c) 4
(d) 8
Answer : C
Question. Who ate most ice -cream?
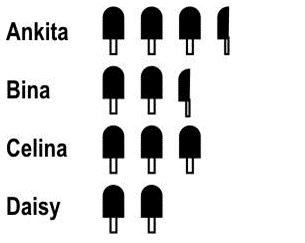
(a) Ankita
(b) Daisy
(c) Celina
(d) Bina
Answer : A
Question. Study the pictograph shown below to answer the question. Mrs. Das conducted a 4-day drama workshop for children in the summer holidays. The pictograph below shows the number of children who attended the workshop each day. On which day were there more boys than girls in the workshop?
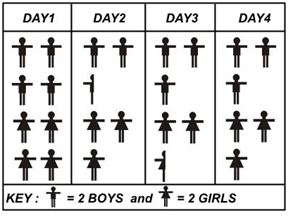
(a) Day 1
(b) Day 2
(c) Day 3
(d) Day 4
Answer : C
Question. Study the pictograph shown below to answer the question. Mrs. Das conducted a 4-day drama workshop for children in the summer holidays. The pictograph below shows the number of children who attended the workshop each day.How many more girls were present on Day 1 of the workshop than on Day 3?
(a) 1
(b) 4
(c) 2
(d) 3
Answer : D
Free study material for Mathematics
NCERT Solutions Class 5 Mathematics Chapter 12 Smart Charts
Students can now access the NCERT Solutions for Chapter 12 Smart Charts prepared by teachers on our website. These solutions cover all questions in exercise in your Class 5 Mathematics textbook. Each answer is updated based on the current academic session as per the latest NCERT syllabus.
Detailed Explanations for Chapter 12 Smart Charts
Our expert teachers have provided step-by-step explanations for all the difficult questions in the Class 5 Mathematics chapter. Along with the final answers, we have also explained the concept behind it to help you build stronger understanding of each topic. This will be really helpful for Class 5 students who want to understand both theoretical and practical questions. By studying these NCERT Questions and Answers your basic concepts will improve a lot.
Benefits of using Mathematics Class 5 Solved Papers
Using our Mathematics solutions regularly students will be able to improve their logical thinking and problem-solving speed. These Class 5 solutions are a guide for self-study and homework assistance. Along with the chapter-wise solutions, you should also refer to our Revision Notes and Sample Papers for Chapter 12 Smart Charts to get a complete preparation experience.
FAQs
The complete and updated is available for free on StudiesToday.com. These solutions for Class 5 Mathematics are as per latest NCERT curriculum.
Yes, our experts have revised the as per 2026 exam pattern. All textbook exercises have been solved and have added explanation about how the Mathematics concepts are applied in case-study and assertion-reasoning questions.
Toppers recommend using NCERT language because NCERT marking schemes are strictly based on textbook definitions. Our will help students to get full marks in the theory paper.
Yes, we provide bilingual support for Class 5 Mathematics. You can access in both English and Hindi medium.
Yes, you can download the entire in printable PDF format for offline study on any device.