
Access the latest CBSE Class 9 Statistics Worksheet Set 01. We have provided free printable Class 9 Mathematics worksheets in PDF format, specifically designed for Chapter 12 Statistics. These practice sets are prepared by expert teachers following the 2025-26 syllabus and exam patterns issued by CBSE, NCERT, and KVS.
Chapter 12 Statistics Mathematics Practice Worksheet for Class 9
Students should use these Class 9 Mathematics chapter-wise worksheets for daily practice to improve their conceptual understanding. This detailed test papers include important questions and solutions for Chapter 12 Statistics, to help you prepare for school tests and final examination. Regular practice of these Class 9 Mathematics questions will help improve your problem-solving speed and exam accuracy for the 2026 session.
Download Class 9 Mathematics Chapter 12 Statistics Worksheet PDF
Question: A survey was conducted among Class 9 students of Ujjwal High School in which each student was asked to name his or her favourite sport and the favourite player from that sport. 40% of the group chose cricket as their favourite sport and of these, 40% named Tendulkar as their favourite player. What percentage of students in the group chose cricket as their favourite sport but did NOT name Tendulkar as their favourite player?
(a) 80%
(b) 60%
(c) 24%
(d) 16%
Answer : C
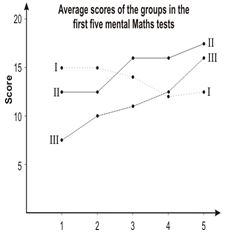
Question: A class is divided into 3 groups. The whole class is given a Mental Maths test every week. The groupwise performance of the class in the first five tests is shown in the graph below.
Study it to answer the question. Which group improved continually over the five tests?,

(a) Group I
(b) Group II
(c) Group III
(d) None of them
Answer : C
Question: A class is divided into 3 groups. The whole class is given a Mental Maths test every week. The groupwise performance of the class in the first five tests is shown in the graph below.
Study it to answer the question. In which test did Group III's average score go above 15 for the first time?

(a) Test 2
(b) Test 3
(c) Test 4
(d) Test 5
Answer : D
Question: A class is divided into 3 groups. The whole class is given a Mental Maths test every week. The groupwise performance of the class in the first five tests is shown in the graph below.
Study it to answer the question. What is the average score of the entire class in Test 2?
(a) 10
(b) 12.5
(c) 13
(d) We can’t say
Answer : D
Question: The average weight of Ajay's brother and sister is 39 kg. The average weight of all three of them is 30 kg. What is Ajay's weight in kilograms?
(a) 3
(b) 9
(c) 12
(d) 34.5
Answer : C
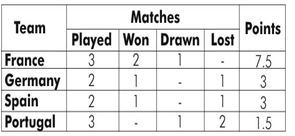
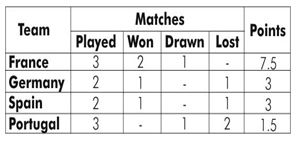
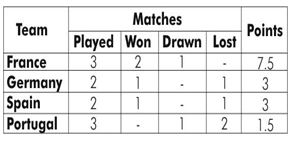
Question: In the first round of a football tournament, there are 4 teams in a group and every team must play one match against every other team in the group. The points table of the group after a few matches is shown below. How many points are given for a win in this round of the tournament?"
Study the paragraph and table given below to answer the question.
(a) 4
(b) 3
(c) 2
(d) 1
Answer : B
Question: In the first round of a football tournament, there are 4 teams in a group and every team must play one match against every other team in the group. The points table of the group after a few matches is shown below.
What was the result of the Germany versus Portugal match?
Study the paragraph and table given below to answer the question.
(a) Germany won
(b) The match was drawn
(c) Match not played yet
(d) Data given is not enough to say anything definitely
Answer : A
Question: In the first round of a football tournament, there are 4 teams in a group and every team must play one match against every other team in the group. The points table of the group after a few matches is shown below.
The first round will be completed after each team has played each of the others once. How many matches of the first round are yet to be played?
(a) 1
(b) 2
(c) 3
(d) 6
Answer : A
Question: The graphs below show the exchange rates for Indian rupees (INR) to 1 US dollar and 1 Euro during the period between May 9 and June 18, 2004. Study the graphs to answer the question. According to the graph shown here, about how many Indian Rupees would Ameena have got in exchange for 100 Euros on May 25?

(a) 27.4
(b) 54.8
(c) 5483
(d) 5556
Answer : C
Question: The graphs below show the exchange rates for Indian rupees (INR) to 1 US dollar and 1 Euro during the period between May 9 and June 18, 2004. Study the graphs to answer the question. During the period shown, on which day was the Indian Rupee STRONGEST against the US dollar? (NOTE: We say that the Rupee is STRONGER when its VALUE IMPROVES when compared to the dollar)

(a) May 15
(b) May 25
(c) Jun 08
(d) June 18
Answer : C
Question: The graphs below show the exchange rates for Indian rupees (INR) to 1 US dollar and 1 Euro during the period between May 9 and June 18, 2004. Study the graphs to answer the question.
During which of the following periods did the Euro gain while the US dollar fell against the Rupee
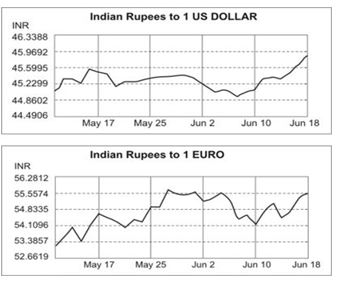
(a) June 2 to June 4
(b) June 8 to June 10
(c) May 25 to May 27
(d) May 17 to May 20
Answer : A
Question: Some children of classes 6 to 10 of Vikas School participate in a race. The time they take to complete is shown in the graph below. The winner of the race was a child from class
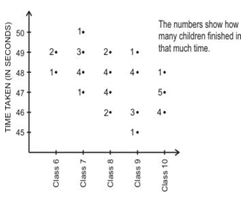
(a) 7
(b) 8
(c) 9
(d) 10
Answer : C
Question: Some children of classes 6 to 10 of Vikas School participate in a race. The time they take to complete is shown in the graph below. The time taken by the maximum number of children to finish the race was:

(a) 46 seconds
(b) 47 seconds
(c) 48 seconds
(d) 49 seconds
Answer : C
Question: Some children of classes 6 to 10 of Vikas School participate in a race. The time they take to complete is shown in the graph below. The average time taken by the class 6 children was,

(a) 15.83 seconds
(b) 48.5 seconds
(c) 48.67 seconds
(d) 48 seconds
Answer : C
Question: Classify the data in Q1 above as primary or secondary data.
Answer : The information which is collected by the investigator himself with a definite objective in his mind is called as primary data whereas when the information is gathered from a source which already had the information stored, it is called as secondary data. It
can be observed that the data in 1, 3, and 5 is secondary data and the data in 2 and 4 is primary data.
Question: The distance (in km) of 40 engineers from their residence to their place of work were found as follows:
5 3 10 20 25 11 13 7 12 31
19 10 12 17 18 11 32 17 16 2 7 9
7 8 3 5 12 15 18 3
12 14 2 9 6 15 15 7 6 12
Construct a grouped frequency distribution table with class size 5 for the data given above taking the first interval as 0 - 5 (5 not included). What main feature do you observe from this tabular representation?
Answer : It is given that a grouped frequency distribution table of class size 5 has to be constructed. Therefore, the class intervals will be 0 − 5, 5 − 10, 10 − 15, 15 −20… By observing the data given as above, a grouped frequency distribution table can be constructed as follows.

It can be observed that there are very few engineers whose homes are at more than or equal to 20 km distance from their work place. Most of the engineers have their workplace up to 15 km distance from their homes.
Question: The heights of 50 students, measured to the nearest centimeters, have been found to be as follows:
161 150 154 165 168 161 154 162 150 151
162 164 171 165 158 154 156 172 160 170
153 159 161 170 162 165 166 168 165 164
154 152 153 156 158 162 160 161 173 166 161
159 162 167 168 159 158 153 154 159
(i) Represent the data given above by a grouped frequency distribution table, taking the class intervals as 160 - 165, 165 - 170, etc.
(ii) What can you conclude bout their heights from the table?
Answer :
(i) A grouped frequency distribution table has to be constructed taking class intervals 160 − 165, 165 − 170, etc. By observing the data given above, the required table can be constructed as follows.
| Height (in cm) | Number of students (frequency ) |
| 150 − 155 | 12 |
| 155 − 160 | 9 |
| 160− 165 | 14 |
| 165 − 170 | 10 |
| 170 − 175 | 5 |
| Total |
50 |
(ii) It can be concluded that more than 50% of the students are shorter than 165 cm.
Question: Three coins were tossed 30 times simultaneously. Each time the number of heads occurring was noted down as follows:
0 1 2 2 1 2 3 1 3 0
1 3 1 1 2 2 0 1 2 1
3 0 0 1 1 2 3 2 2 0
Prepare a frequency distribution table for the data given above.
Answer : By observing the data given above, the required frequency distribution table can be constructed as follows.
| Number of heads | Number of times (frequency) |
| 0 | 6 |
| 1 | 10 |
| 2 | 9 |
| 3 | 5 |
| Total | 30 |
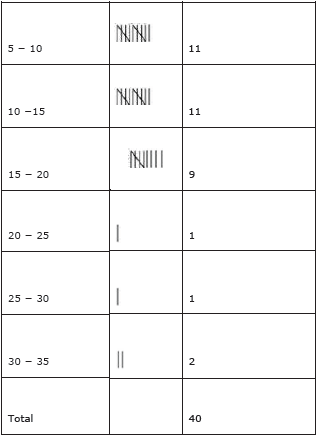
Question: Thirty children were asked about the number of hours they watched TV programmes in the previous week. The results were found as follows:
1 6 2 3 5 12 5 8 4 8
10 3 4 12 2 8 15 1 17 6
3 2 8 5 9 6 8 7 14 12
(i) Make a grouped frequency distribution table for this data, taking class width 5 and one of the class intervals as 5 - 10.
(ii) How many children watched television for 15 or more hours a week?
Answer :
(i) Our class intervals will be 0 − 5, 5 − 10, 10 −15…..
The grouped frequency distribution table can be constructed as follows.
| Hours | Number of children |
| 0 − 5 | 10 |
| 5 − 10 | 13 |
| 10 −15 | 5 |
| 15 −20 | 2 |
| Total | 30 |
(ii) The number of children who watched TV for 15 or more hours a week is 2 (i.e., the number of children in class interval 15 − 20).
Question: A survey conducted by an organisation for the cause of illness and death among the women between the ages 15 − 44 (in years) worldwide, found the following figures (in
%):
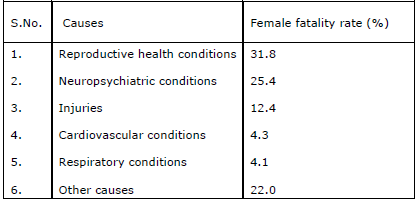
(i) Represent the information given above graphically.
(ii) Which condition is the major cause of women’s ill health and death worldwide?
(iii) Try to find out, with the help of your teacher, any two factors which play a major role in the cause in
(ii) above being the major cause.
Answer :
(i) By representing causes on x-axis and family fatality rate on y-axis and choosing an appropriate scale (1 unit = 5% for y axis), the graph of the information given above can be constructed as follows.

Question: Given below are the seats won by different political parties in the polling outcome of a state assembly elections:
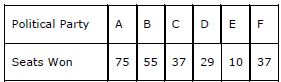
Political Party A B C D E F
Seats Won 75 55 37 29 10 37
(i) Draw a bar graph to represent the polling results.
(ii) Which political party won the maximum number of seats?
Answer :
(i) By taking polling results on x-axis and seats won as y-axis and choosing an appropriate scale (1 unit = 10 seats for y-axis), the required graph of the above information can be constructed as follows.
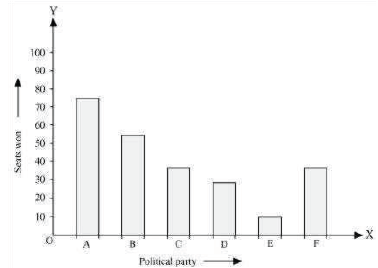
Here, the rectangle bars are of the same length and have equal spacing in between them.
(ii) Political party ‘A’ won maximum number of seats.
Question: The following table gives the life times of neon lamps:
| Length (in hours) | Number of lamps |
| 300 − 400 | 14 |
| 400 − 500 | 56 |
| 500 − 600 | 60 |
| 600 − 700 | 86 |
| 700 − 800 | 74 |
| 800 − 900 | 62 |
| 900 − 1000 | 48 |
(i) Represent the given information with the help of a histogram.
(ii) How many lamps have a lifetime of more than 700 hours?
Answer :
(i) By taking life time (in hours) of neon lamps on x-axis and the number of lamps on y-axis, the histogram of the given information can be drawn as follows.
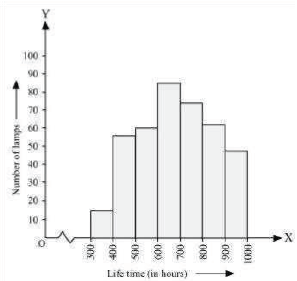
Here, 1 unit on y-axis represents 10 lamps.
(ii) It can be concluded that the number of neon lamps having their lifetime more than 700 is the sum of the number of neon lamps having their lifetime as 700− 800, 800 − 900, and 900 − 1000.
Therefore, the number of neon lamps having their lifetime more than 700 hours is 184. (74 + 62 + 48 = 184)


Free study material for Mathematics
Chapter 12 Statistics CBSE Class 9 Mathematics Worksheet
Students can use the Chapter 12 Statistics practice sheet provided above to prepare for their upcoming school tests. This solved questions and answers follow the latest CBSE syllabus for Class 9 Mathematics. You can easily download the PDF format and solve these questions every day to improve your marks. Our expert teachers have made these from the most important topics that are always asked in your exams to help you get more marks in exams.
NCERT Based Questions and Solutions for Chapter 12 Statistics
Our expert team has used the official NCERT book for Class 9 Mathematics to create this practice material for students. After solving the questions our teachers have also suggested to study the NCERT solutions which will help you to understand the best way to solve problems in Mathematics. You can get all this study material for free on studiestoday.com.
Extra Practice for Mathematics
To get the best results in Class 9, students should try the Mathematics MCQ Test for this chapter. We have also provided printable assignments for Class 9 Mathematics on our website. Regular practice will help you feel more confident and get higher marks in CBSE examinations.
FAQs
You can download the teacher-verified PDF for CBSE Class 9 Statistics Worksheet Set 01 from StudiesToday.com. These practice sheets for Class 9 Mathematics are designed as per the latest CBSE academic session.
Yes, our CBSE Class 9 Statistics Worksheet Set 01 includes a variety of questions like Case-based studies, Assertion-Reasoning, and MCQs as per the 50% competency-based weightage in the latest curriculum for Class 9.
Yes, we have provided detailed solutions for CBSE Class 9 Statistics Worksheet Set 01 to help Class 9 and follow the official CBSE marking scheme.
Daily practice with these Mathematics worksheets helps in identifying understanding gaps. It also improves question solving speed and ensures that Class 9 students get more marks in CBSE exams.
All our Class 9 Mathematics practice test papers and worksheets are available for free download in mobile-friendly PDF format. You can access CBSE Class 9 Statistics Worksheet Set 01 without any registration.