
Access the latest CBSE Class 9 Mathematics Statistics Worksheet Set 01. We have provided free printable Class 9 Mathematics worksheets in PDF format, specifically designed for Chapter 12 Statistics. These practice sets are prepared by expert teachers following the 2025-26 syllabus and exam patterns issued by CBSE, NCERT, and KVS.
Chapter 12 Statistics Mathematics Practice Worksheet for Class 9
Students should use these Class 9 Mathematics chapter-wise worksheets for daily practice to improve their conceptual understanding. This detailed test papers include important questions and solutions for Chapter 12 Statistics, to help you prepare for school tests and final examination. Regular practice of these Class 9 Mathematics questions will help improve your problem-solving speed and exam accuracy for the 2026 session.
Download Class 9 Mathematics Chapter 12 Statistics Worksheet PDF
Question : Give five examples of data that you can collect from day to day life.
Answer:
In our day to day life, we can collect the following data.
1. Number of females per 1000 males in various states of our country
2. Weights of students of our class
3. Production of wheat in the last 10 years in our country
4. Number of plants in our locality 5. Rainfall in our city in the last 10 year
Question : The blood groups of 30 students of Class VIII are recoded as follows:
A, B, O, O, AB, O, A, O, B, A, O, B, A, O, O,
A, AB, O, A, A, O, O, AB, B, A, O, B, A, B, O.
Represent this data in the form of a frequency distribution table. Which is the most common, and which is the rarest, blood group among these students?
Answer:
It can be observed that 9 students have their blood group as A, 6 as B, 3 as AB, and 12 as O.
Therefore, the blood group of 30 students of the class can be represented as follows.
| Blood group | Number of students |
| A | 9 |
| B | 6 |
| AB | 3 |
| O | 12 |
| Total | 30 |
It can be observed clearly that the most common blood group and the rarest blood group among these students is O and AB respectively as 12 (maximum number of students) have their blood group as O, and 3 (minimum number of students) have their blood group as AB.
Question : The relative humidity (in %) of a certain city for a month of 30 days was as follows:
98.1 98.6 99.2 90.3 86.5 95.3 92.9 96.3 94.2 95.1
89.2 92.3 97.1 93.5 92.7 95.1 97.2 93.3 95.2 97.3
96.2 92.1 84.9 90.2 95.7 98.3 97.3 96.1 92.1 89
(i) Construct a grouped frequency distribution table with classes
84 - 86, 86 - 88
(ii) Which month or season do you think this data is about?
(iii) What is the range of this data?
Answer:
(i) A grouped frequency distribution table of class size 2 has to be constructed. The class intervals will be 84 − 86, 86 − 88, and 88 − 90…
By observing the data given above, the required table can be constructed as follows.
| Relative humidity (in %) | Number of days (frequency ) |
| 84 − 86 |
1 |
| 86 − 88 |
1 |
| 88 − 90 |
2 |
| 90 − 92 |
2 |
| 92 − 94 |
7 |
| 94 − 96 |
6 |
| 96 − 98 |
7 |
| 98 − 100 |
4 |
| Total |
30 |
(ii) It can be observed that the relative humidity is high. Therefore, the data is about a month of rainy season.
(iii) Range of data = Maximum value − Minimum value
= 99.2 − 84.9 = 14.3
Question : A study was conducted to find out the concentration of sulphur dioxide in the air in parts per million (ppm) of a certain city. The data obtained for 30 days is as follows:
0.03 0.08 0.08 0.09 0.04 0.17
0.16 0.05 0.02 0.06 0.18 0.20
0.11 0.08 0.12 0.13 0.22 0.07
0.08 0.01 0.10 0.06 0.09 0.18
0.11 0.07 0.05 0.07 0.01 0.04
(i) Make a grouped frequency distribution table for this data with class intervals as 0.00 - 0.04, 0.04 - 0.08, and so on.
(ii) For how many days, was the concentration of sulphur dioxide more than 0.11 parts per million?
Answer:
Taking class intervals as 0.00, −0.04, 0.04, −0.08, and so on, a grouped frequency table can be constructed as follows.
| Concentration of SO2 (in ppm) | Number of days (frequency ) |
| 0.00 − 0.04 | 4 |
| 0.04 − 0.08 | 9 |
| 0.08 − 0.12 | 9 |
| 0.12 − 0.16 | 2 |
| 0.16 − 0.20 | 4 |
| 0.20 − 0.24 | 2 |
| Total | 30 |
The number of days for which the concentration of SO2 is more than 0.11 is the number of days for which the concentration is in between 0.12 − 0.16, 0.16 − 0.20, 0.20 − 0.24.
Required number of days = 2 + 4 + 2 = 8
Therefore, for 8 days, the concentration of SO2 is more than 0.11 ppm.
Question : The value of π up to50 decimal places is given below:
3.14159265358979323846264338327950288419716939937510
(i) Make a frequency distribution of the digits from 0 to 9 after the decimal point.
(ii) What are the most and the least frequently occurring digits?
Answer:
(i) By observation of the digits after decimal point, the required table can be constructed as follows.
| Digit | Frequency |
| 0 | 2 |
| 1 | 5 |
| 2 | 5 |
| 3 | 8 |
| 4 | 4 |
| 5 | 5 |
| 6 | 4 |
| 7 | 4 |
| 8 | 5 |
| 9 | 8 |
| Total | 50 |
(ii) It can be observed from the above table that the least frequency is 2 of digit 0, and the maximum frequency is 8 of digit 3 and 9. Therefore, the most frequently occurring digits are 3 and 9 and the least frequently occurring digit is 0.
Question : A company manufactures car batteries of a particular type. The lives (in years) of 40 such batteries were recorded as follows:
2.6 3.0 3.7 3.2 2.2 4.1 3.5 4.5
3.5 2.3 3.2 3.4 3.8 3.2 4.6 3.7
2.5 4.4 3.4 3.3 2.9 3.0 4.3 2.8
3.5 3.2 3.9 3.2 3.2 3.1 3.7 3.4
4.6 3.8 3.2 2.6 3.5 4.2 2.9 3.6
Construct a grouped frequency distribution table for this data, using class intervals of size 0.5 starting from the intervals 2 − 2.5.
Answer:
A grouped frequency table of class size 0.5 has to be constructed, starting from class interval 2 − 2.5.
Therefore, the class intervals will be 2 − 2.5, 2.5 − 3, 3 − 3.5…
By observing the data given above, the required grouped frequency distribution table can be constructed as follows.
| Lives of batteries (in hours) | Number of batteries |
| 2 − 2.5 | 2 |
| 2.5 − 3.0 | 6 |
| 3.0 − 3.5 | 14 |
| 3.5− 4.0 | 11 |
| 4.0 − 4.5 | 4 |
| 4.5 − 5.0 | 3 |
| Total | 40 |
Question : The following data on the number of girls (to the nearest ten) per thousand boys in different sections of Indian society is given below.
| Section | Number of girls per thousand boys |
| Scheduled Caste (SC) |
940 |
| Scheduled Tribe (ST) |
970 |
| Non SC/ST |
920 |
| Backward districts |
950 |
| Non-backward districts |
920 |
| Rural |
930 |
| Urban |
910 |
(i) Represent the information above by a bar graph.
(ii) In the classroom discuss what conclusions can be arrived at from the graph.
Answer:
(i) By representing section (variable) on x-axis and number of girls per thousand boys on y-axis, the graph of the information given above can be constructed by choosing an appropriate scale (1 unit = 100 girls for y-axis)

Here, all the rectangle bars are of the same length and have equal spacing in between them.
(ii) It can be observed that maximum number of girls per thousand boys (i.e., 970) is for ST and minimum number of girls per thousand boys (i.e., 910) is for urban. Also, the number of girls per thousand boys is greater in rural areas than that in urban areas, backward districts than that in non-backward districts, SC and ST than that in nonSC/ST.
Question : The length of 40 leaves of a plant are measured correct to one millimetre, and the obtained data is represented in the following table:
| Length (in mm) |
Number of leaves |
| 118 − 126 | 3 |
| 127 − 135 | 5 |
| 136 − 144 | 9 |
| 145 − 153 | 12 |
| 154 − 162 | 5 |
| 163 − 171 | 4 |
| 172 − 180 | 2 |
(i) Draw a histogram to represent the given data.
(ii) Is there any other suitable graphical representation for the same data?
(iii) Is it correct to conclude that the maximum number of leaves are 153 mm long?
Why?
Answer:
(i) It can be observed that the length of leaves is represented in a discontinuous class interval having a difference of 1 in between them. Therefore,1/2 =0.5 has to be added to each upper class limit and also have to subtract 0.5 from the lower class limits so as to make the class intervals continuous.
| Length (in mm) | Number of leaves |
| 117.5 − 126.5 | 3 |
| 126.5 − 135.5 | 5 |
| 135.5 − 144.5 | 9 |
| 144.5 − 153.5 | 12 |
| 153.5 − 162.5 | 5 |
| 162.5 − 171.5 | 4 |
| 171.5 − 180.5 | 2 |
Taking the length of leaves on x-axis and the number of leaves on y-axis, the histogram of this information can be drawn as above.
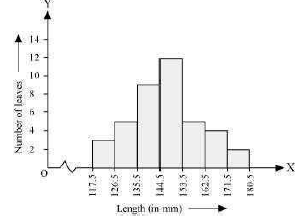
Here, 1 unit on y-axis represents 2 leaves.
(ii) Other suitable graphical representation of this data is frequency polygon. (iii) No, as maximum number of leaves (i.e., 12) has their length in between 144.5 mm and 153.5 mm. It is not necessary that all have their lengths as 153 mm.
Question : The following table gives the distribution of students of two sections according to the mark obtained by them:
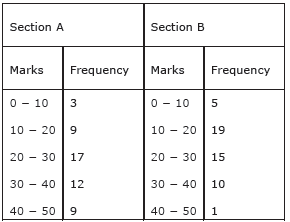
Represent the marks of the students of both the sections on the same graph by two frequency polygons. From the two polygons compare the performance of the two sections.
Answer: We can find the class marks of the given class intervals by using the following formula.
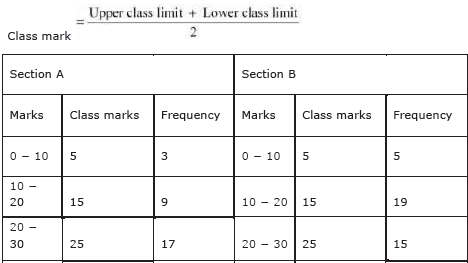
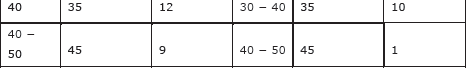
Taking class marks on x-axis and frequency on y-axis and choosing an appropriate scale (1 unit = 3 for y-axis), the frequency polygon can be drawn as follows.
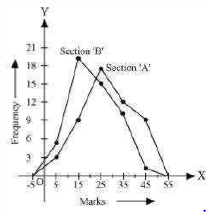
It can be observed that the performance of students of section ‘A’ is better than the students of section ‘B’ in terms of good marks.
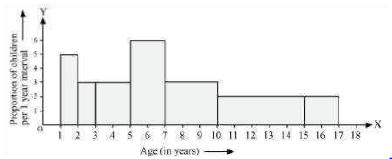
Question : A random survey of the number of children of various age groups playing in park was found as follows:
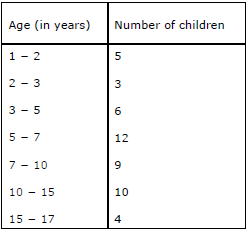
Draw a histogram to represent the data above.
Answer:
Here, it can be observed that the data has class intervals of varying width. The proportion of children per 1 year interval can be calculated as follows.
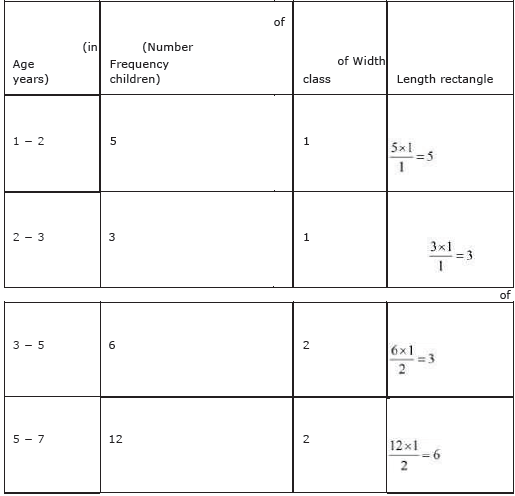
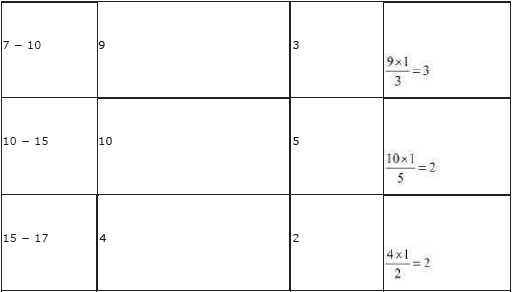
Taking the age of children on x-axis and proportion of children per 1 year interval on y-axis, the histogram can be drawn as follows.


Free study material for Mathematics
Chapter 12 Statistics CBSE Class 9 Mathematics Worksheet
Students can use the Chapter 12 Statistics practice sheet provided above to prepare for their upcoming school tests. This solved questions and answers follow the latest CBSE syllabus for Class 9 Mathematics. You can easily download the PDF format and solve these questions every day to improve your marks. Our expert teachers have made these from the most important topics that are always asked in your exams to help you get more marks in exams.
NCERT Based Questions and Solutions for Chapter 12 Statistics
Our expert team has used the official NCERT book for Class 9 Mathematics to create this practice material for students. After solving the questions our teachers have also suggested to study the NCERT solutions which will help you to understand the best way to solve problems in Mathematics. You can get all this study material for free on studiestoday.com.
Extra Practice for Mathematics
To get the best results in Class 9, students should try the Mathematics MCQ Test for this chapter. We have also provided printable assignments for Class 9 Mathematics on our website. Regular practice will help you feel more confident and get higher marks in CBSE examinations.
FAQs
You can download the teacher-verified PDF for CBSE Class 9 Mathematics Statistics Worksheet Set 01 from StudiesToday.com. These practice sheets for Class 9 Mathematics are designed as per the latest CBSE academic session.
Yes, our CBSE Class 9 Mathematics Statistics Worksheet Set 01 includes a variety of questions like Case-based studies, Assertion-Reasoning, and MCQs as per the 50% competency-based weightage in the latest curriculum for Class 9.
Yes, we have provided detailed solutions for CBSE Class 9 Mathematics Statistics Worksheet Set 01 to help Class 9 and follow the official CBSE marking scheme.
Daily practice with these Mathematics worksheets helps in identifying understanding gaps. It also improves question solving speed and ensures that Class 9 students get more marks in CBSE exams.
All our Class 9 Mathematics practice test papers and worksheets are available for free download in mobile-friendly PDF format. You can access CBSE Class 9 Mathematics Statistics Worksheet Set 01 without any registration.