
Download the latest CBSE Class 11 Mathematics Statistics Notes in PDF format. These Class 11 Mathematics revision notes are carefully designed by expert teachers to align with the 2026-27 syllabus. These notes are great daily learning and last minute exam preparation and they simplify complex topics and highlight important definitions for Class 11 students.
Revision Notes for Class 11 Mathematics Chapter 13 Statistics
To secure a higher rank, students should use these Class 11 Mathematics Chapter 13 Statistics notes for quick learning of important concepts. These exam-oriented summaries focus on difficult topics and high-weightage sections helpful in school tests and final examinations.
Chapter 13 Statistics Revision Notes for Class 11 Mathematics
XI: Math
Chapter 15: Statistics
Chapter Notes
Key Concepts
1. Statistics deals with collection presentation, analysis and interpretation ofthe data.
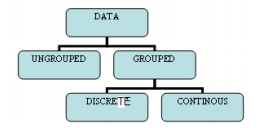
2. Data can be either ungrouped or grouped. Further, grouped data could becategorized into:
(a) Discrete frequency distribution,
(b) Continuous frequency distribution.
3. Data can be represented in the form of tables or in the form of graphs.Common graphical forms are: Bar charts,pie diagrams, histograms, frequency polygons ogives, etc.
4. First order of comparison for the given data is the measures of centraltendencies. Commonly used measures are (i) Arithmetic mean (ii) Median (iii) Mode.
5. Arithmetic mean or simply mean is the sum of all observations divided bythe number of observations. It cannot be determined graphically. Arithmetic mean is not a suitable measure in case of extreme values in the data.
6. Median is the measure which divides the data in two equal parts. Themedian is the middle term when the data is sorted.
Incase of odd observations the middle observation is median. In case of even observations the median is the average of the two middle observations.
7. Median can be determined graphically. It does not take into account all the observations.
8. The mode is the most frequently occurring observation. For a frequency distribution mode may or may not be defined uniquely.
9. Measures of central tendencies namely mean, median and mode provide us with a single value which is the representative of the entire data. These three measures try to condense the entire data into a single central value
10. Central tendencies indicate the general magnitude of the data.
11. Two frequency distributions may have same central value but still they have different spread or they vary in their variation from central position. So it is important to study how the other observations are scattered around this central position.
12. Two distributions with same mean can have different spread as shownbelow.
13. Variability or dispersion captures the spread of data. Dispersion helps usto differentiate the data when the measures of central tendency are the same.
14. Like ‘measures of central tendency’ gives a single value to describe themagnitude of data. Measures of dispersion gives a single value to describe variability.
15. The dispersion or scatter of a dataset can be measured from twoperspectives:
(i) Taking the order of the observations into consideration, two measures are
(a) Range (b) Quartile deviation
(ii)Taking the distance of each observation from the central position, yields two measures, (a) Mean deviation, (b) Variance and Standard deviation
16. Range is the difference between the highest and the lowest observationin the given data.
The greater the range is for a data, its observations are far more scattered than the one whose range is smaller.
17. The range at best gives a rough idea of the variability or scatter.
18. Quartile divides the data into 4 parts. There are three quartiles namely Q1Q2 Q3 and Q2 is the median only.
19. The quartile deviation is one-half of the difference between the upperquartile and the lower quartile.
20. If x1, x2, … xn are the set of points and point a is the mean of the data.Then the quantity xi –a is called the deviation of xi from mean a. Then the sum of the deviations from mean is always zero.
21.In order to capture average variation we must get rid of the negativesigns of deviations.
There are two remedies
Remedy I: take the Absolute values of the deviations.
Remedy II: take the squares of the deviation.
22. Mean of the absolute deviations about a gives the ‘mean deviation about a’, where a is the mean. It is denoted as M.D. (a). Therefore,
M.D.(a) = Sum of absolute values of deviations from the mean 'a ' divided by the number of observations. Mean deviation can be calculated about median or mode or any other observations.
23. Merits of mean deviation
(1) It utilizes all the observations of the set.
(2) It is least affected by the extreme values.
(3) It is simple to calculate and understand.
24. Mean deviation is the least when calculated about the median.
If the variations between the values is very high, then the median will not be an appropriate central tendency representative.
.
25. Limitations of Mean Deviation
i)The foremost weakness of mean deviation is that in its calculations, negative differences are considered positive without any sound reasoning
ii) It is not amenable to algebraic treatment.
(iii) It cannot be calculated in the case of open end(s) classes in the frequency distribution.
26. Measure of variation based on taking the squares of the deviation is called the variance.
27. Let the observations are x1, x2, x3,..,xn let mean = x
Squares of deviations:
di = ( xi - x)2
Case 1: The sum di is zero. This will imply that all observations are equal to the mean x bar.
Case 2: The sum di is relatively small. This will imply that there is a lowerdegree of dispersion. And case three
Case 3: The sum di is large. There seems to be a high degree of dispersion.
28. Variance is given by the mean of squared deviations. If variance is small the data points are clustering around mean otherwise they are spread across.
29. Standard deviation is simply expressed as the positive square root of variance of the given data set. Standard deviation of the set of observations
Please click the link below to download pdf file for CBSE Class 11 Mathematics - Statistics Concepts.
Free study material for Mathematics
CBSE Class 11 Mathematics Chapter 13 Statistics Notes
Students can use these Revision Notes for Chapter 13 Statistics to quickly understand all the main concepts. This study material has been prepared as per the latest CBSE syllabus for Class 11. Our teachers always suggest that Class 11 students read these notes regularly as they are focused on the most important topics that usually appear in school tests and final exams.
NCERT Based Chapter 13 Statistics Summary
Our expert team has used the official NCERT book for Class 11 Mathematics to design these notes. These are the notes that definitely you for your current academic year. After reading the chapter summary, you should also refer to our NCERT solutions for Class 11. Always compare your understanding with our teacher prepared answers as they will help you build a very strong base in Mathematics.
Chapter 13 Statistics Complete Revision and Practice
To prepare very well for y our exams, students should also solve the MCQ questions and practice worksheets provided on this page. These extra solved questions will help you to check if you have understood all the concepts of Chapter 13 Statistics. All study material on studiestoday.com is free and updated according to the latest Mathematics exam patterns. Using these revision notes daily will help you feel more confident and get better marks in your exams.
FAQs
You can download the teacher prepared revision notes for CBSE Class 11 Mathematics Statistics Notes from StudiesToday.com. These notes are designed as per 2026-27 academic session to help Class 11 students get the best study material for Mathematics.
Yes, our CBSE Class 11 Mathematics Statistics Notes include 50% competency-based questions with focus on core logic, keyword definitions, and the practical application of Mathematics principles which is important for getting more marks in 2026 CBSE exams.
Yes, our CBSE Class 11 Mathematics Statistics Notes provide a detailed, topic wise breakdown of the chapter. Fundamental definitions, complex numerical formulas and all topics of CBSE syllabus in Class 11 is covered.
These notes for Mathematics are organized into bullet points and easy-to-read charts. By using CBSE Class 11 Mathematics Statistics Notes, Class 11 students fast revise formulas, key definitions before the exams.
No, all study resources on StudiesToday, including CBSE Class 11 Mathematics Statistics Notes, are available for immediate free download. Class 11 Mathematics study material is available in PDF and can be downloaded on mobile.