
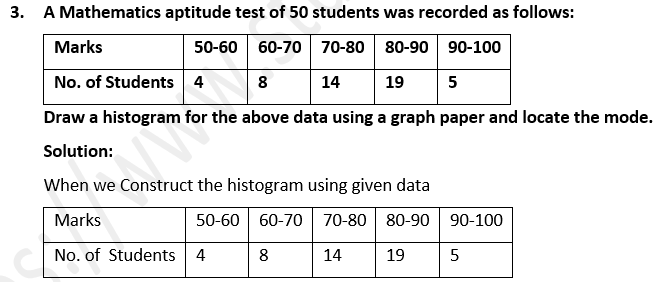
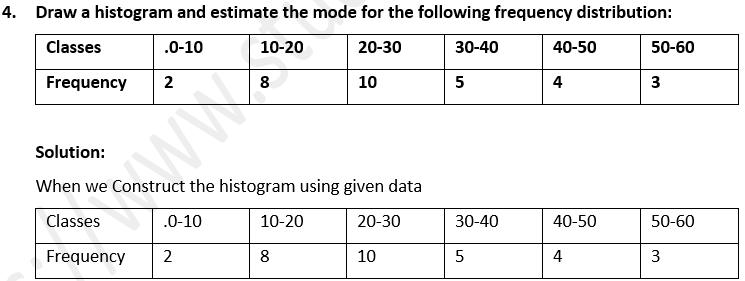
1. (a) Find out the arithmetic mean of 5.7,6.6,7.2,9.3,6.2.
(b) The weights (in kg) of 8 new born babies are 3,3.2,3.4,3.5,4,3.6,4.1,3.2. Find out the mean weight of the babies.
Solution:
As we have Given observations are 5.7, 6.6, 7.2, 9.3, 6.2.
So, Number of observations = 5
Mean =(sum of observations)/(number of observations)
Mean =(5.7+6.6+7.2+9.3+6.2)/5 =35/5 = 7
Therefore, the mean of the given observations is 7.
(b) As we have given that, weight of babies are 3,3.2,3.4,3.5,4,3.6,4.1,3.2
So, Number of observations = 8
Mean =(sum of observations)/(number of observations)
∴Mean =(3+3.2+3.4+3.5+4+3.6+4.1+3.2)/8 =28/8 = 3.5 kg
Therefore , the mean of the weight of babies is 3.5 kg
2. The marks obtained by 15 students in a class test are 12, 14, 07, 09, 23, 11, 08, 13, 11, 19, 16, 24, 17, 03, 20
Find out (i) the mean of their marks.
(ii) the mean of their marks when the marks of each student are increased by 4.
(iii) the mean of their marks when 2 marks are deducted from the marks of each student.
(iv) the mean of their marks when the marks of each student are doubled.
Solution:-
(i) As we have given Marks obtained by students are 12, 14, 07, 09, 23, 11, 08, 13, 11, 19, 16, 24, 17, 03, 20.
Number of students = 15
Mean = (sum of observations)/(number of observations)
= 12+14+07+09+23+11+08+13+11+19+16+24+17+03+20
=207/15 = 13.8
Therefore, the mean of their marks is 13.8.
(ii) When mark of each student is increased by 4, total increased marks
= 4×15 = 60
Then Total increase in sum of marks = 207+60 = 267
∴ mean=(sum of observations)/(number of observations)
∴ mean =267/15 = 17.8
Therefore , the mean is 17.8.
(iii) when mark of each student is deducted by 2,
Then total deducted marks = 2×15 = 30
Total decrease in sum of marks = 207-30 = 177
∴ mean = sum of marks/number of students
∴ mean =177/15 = 11.8
Therefore the mean is 11.8.
(iv) when mark of each student is doubled , then new sum of marks = 2×207 = 414
∴mean = new sum of marks/number of students
∴mean =414/15 = 27.6
Therefore , the mean is 27.6.
3. (a) The mean of the numbers 6,y,7,x,14 is 8. Express y in terms of x.
(b) The mean of 9 variates is 11.
If eight of them are 7,12,9,14,21,3,8 and 15. Find out the 9th variate.
Solution:
(a)As we have the Given observations are 6,y,7,x,14.
Mean = 8
As we have given Number of observations = 5
Mean (sum of observations)/(number of observations)
∴8 =(6+y+7+x+14)/5
∴40 = 27+x+y
40-27= x+y
13= x+y
∴y = 13-x
Therefore, the answer is y = 13-x.
(b)As we have the Given mean = 11
Number of variates = 9
Variates are 7,12,9,14,21,3,8 ,15
Let the 9th variate be x.
Sum of variates = 7+12+9+14+21+3+8+15+x
= 89+x
Mean = (Sum of variates)/(number of variates)
∴11 =(89+x)/9=11×9
= 89+x
99= 89+x
∴x = 99-89
= 10
∴ the 9th variate is 10.
4. (a) The mean age of 33 students of a class is 13 years. If one girl leaves the class, the mean becomes 121516 years. What is the age of the girl ?
(b) In a class test, the mean of marks scored by a class of 40 students was calculated as 18.2. Later on, it was detected that marks of one student was wrongly copied as 21 instead of 29. Find out the correct mean.
Solution:
(a) As we have the Given mean age = 13
As the Number of students = 33
Sum of ages = mean x number of students
= 13×33
= 429
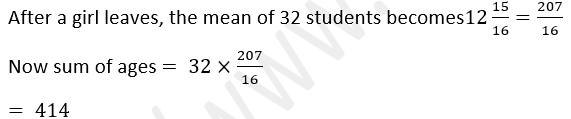
So the age of the girl who left = 429−414 = 15 years
Therefore the age of the girl who left is 15 years.
(b)As Mean of marks = 18.2
Number of students = 40
Total marks of 40 students = 40×18.2
= 728
Difference of marks when copied wrongly
= 29−21
= 8
So total marks = 728+8 = 736
∴mean =73640 = 18.4
Therefore, the correct mean is 18.4.
5. Find out the mean of 25 given numbers when the mean of 10 of them is 13 and the mean of the remaining numbers is 18.
Solution:
As we have Mean of 10 numbers = 13
∴Sum of numbers = 13×10
= 130
Mean of remaining 15 numbers = 18
∴Sum of numbers = 15×18
= 270
∴Sum of all numbers = 130+270
= 400
∴Mean = (sum ofnumbers)/25 =400/25
= 16
Therefore, the mean of 25 numbers is 16.
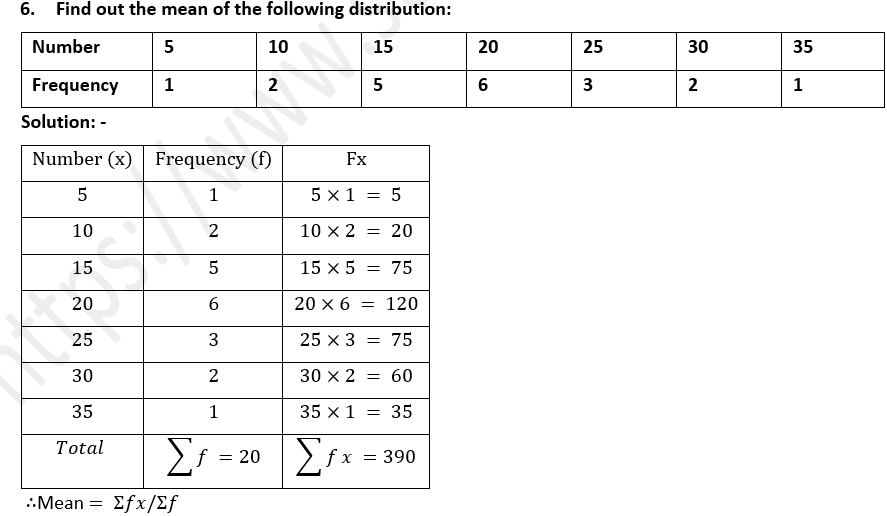
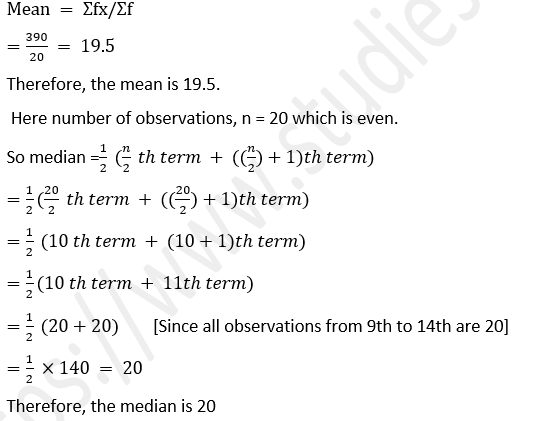
=390/20
= 19.5
Therefore the mean is 19.5.
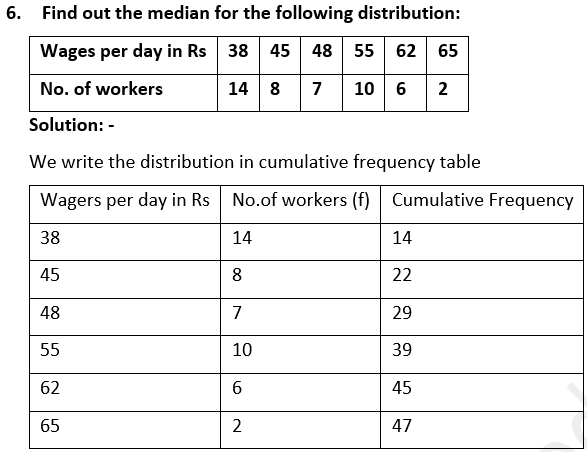
7. The contents of 100 match boxes were checked to determine the number of matches they contained
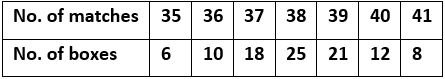
(i) Find out, correct to one decimal place, the mean number of matches per box.
(ii) Determine how many extra matches would have to be added to the total contents of the 100 boxes to; bring the mean up to exactly 39 matches.
Solution:-
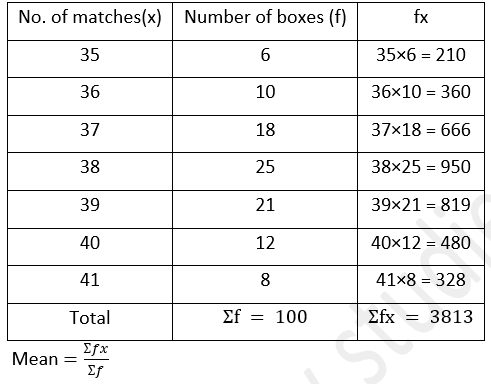
= 3813/100
= 38.13
= 38.1
Therefore , the mean is 38.1.
(ii)As the New mean = 39
∴ Ʃfx = 39×100
= 3900
So, when number of extra matches to be added = 3900-3813
= 87
Therefore , the number of extra matches to be added is 87.
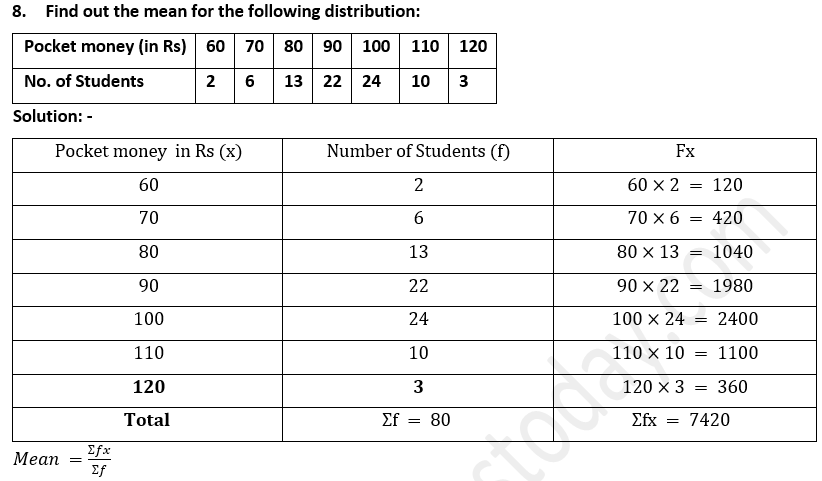
= 7420/80
= 92.75
Therefore, the mean is 92.75.
9. Six coins were tossed 1000 times, and at each toss the number of heads were counted and the results were recorded as under :
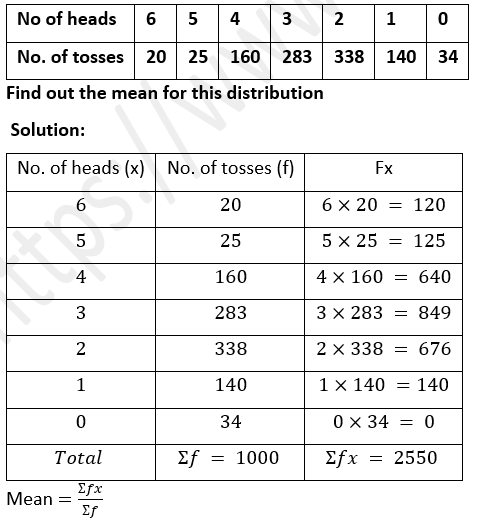
=2550/1000
= 2.55
Therefore, the mean is 2.55.
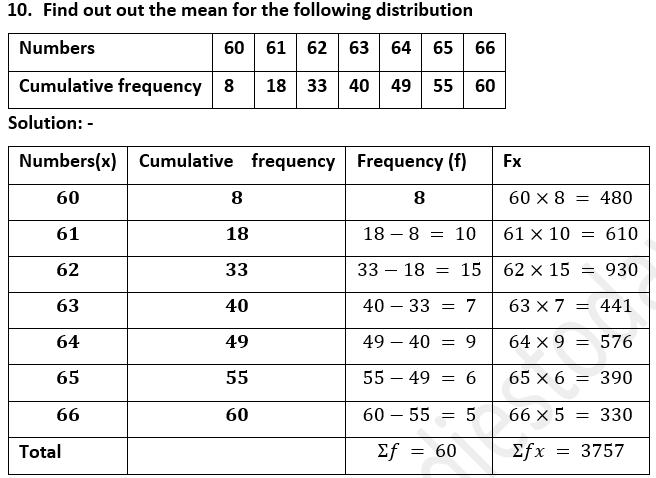
∴Mean =Ʃfx/Ʃf
=3757/60
= 62.616
= 62.62
Therefore , the mean is 62.62.
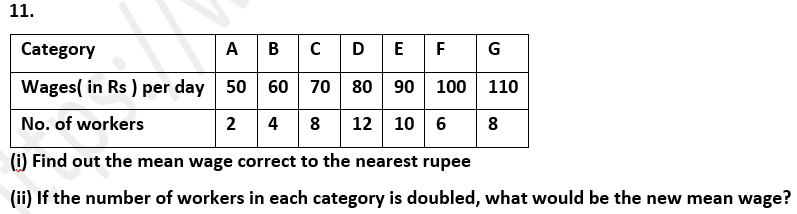
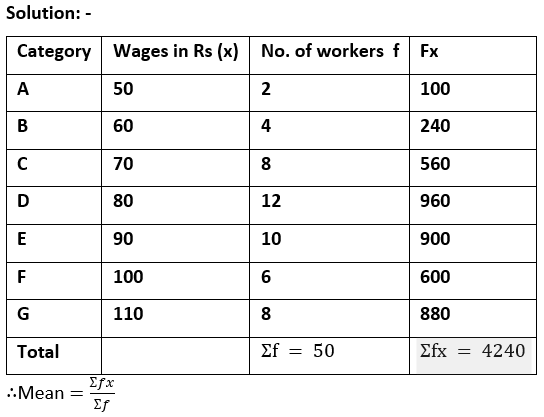
= 4240/50
= 84.8
= 85
Therefore, the mean is 85.
(ii)When number of workers is doubled,
then total number of workers = 50×2
= 100
So wages will be doubled.
∴Total wages = 4240×2
= 8480
∴Mean =Ʃfx/Ʃf =8480/100
= 84.8
= 85
Therefore, the mean is 85.
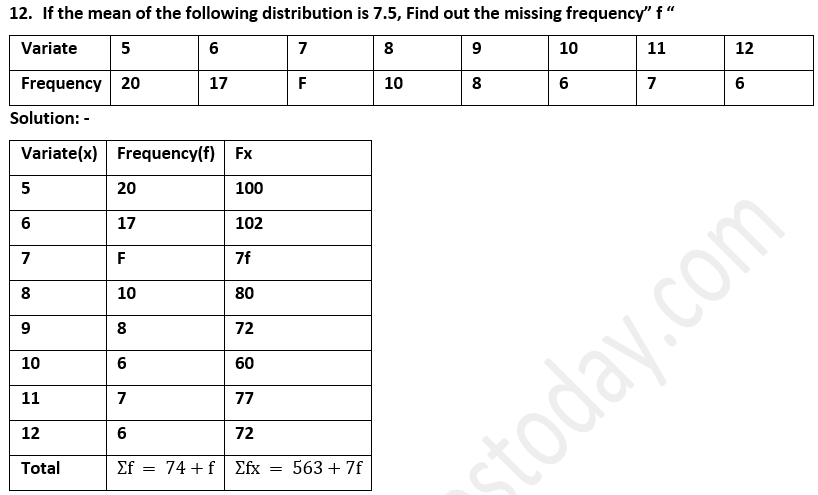
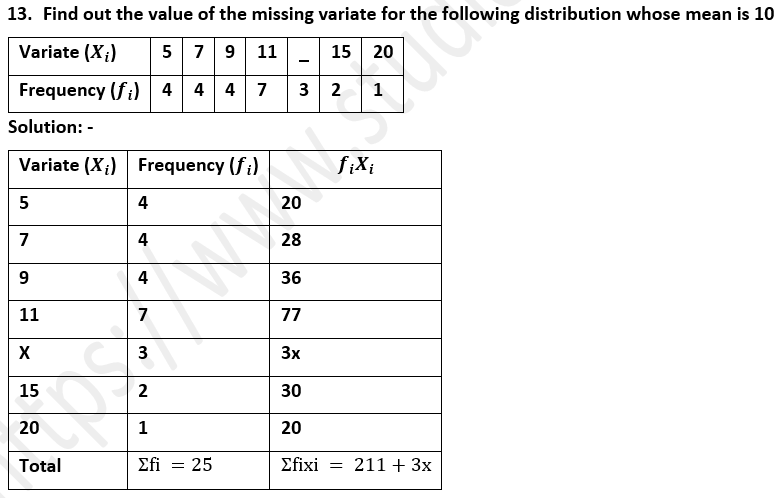
7.5×(74+f)= 563+7f
555+7.5f = 563+7f
7.5f-7f = 563-555
0.5f = 8
∴f = 8/0.5 = 16
Therefore, the value of missing frequency f is 16.
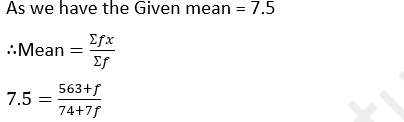
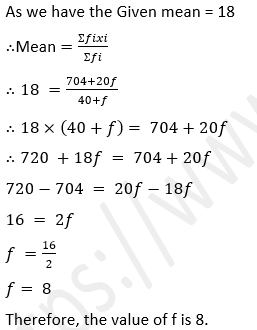
As we have Given mean = 10
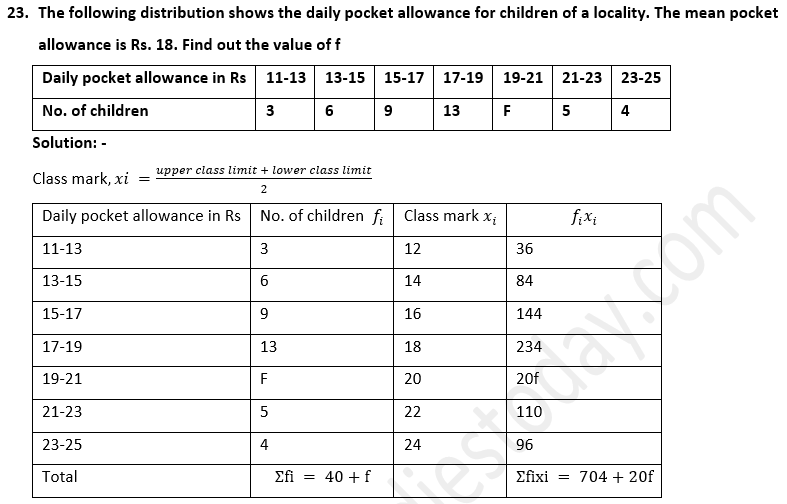
Mean = Ʃfixi/Ʃfi
∴10=(211+3x)/25
10×25 = 211+3x
250 = 211+3x
250-211 = 3x
39 = 3x
x =39/3
x = 13
Therefore, the missing variate is 13.
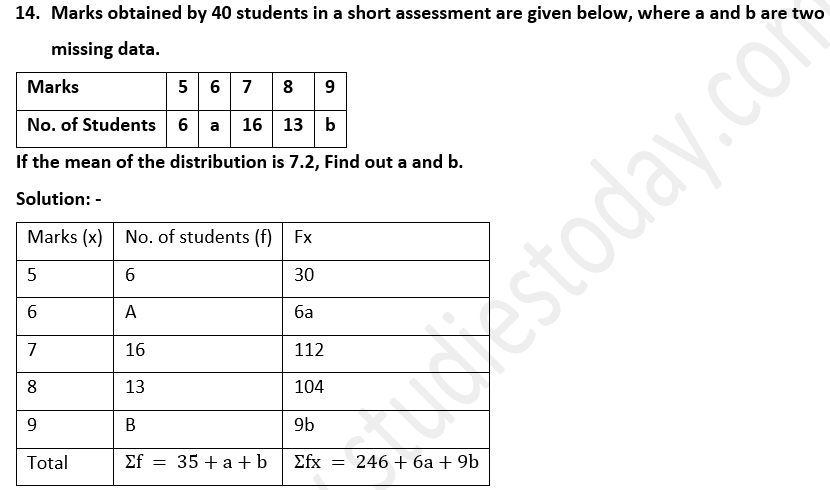
As we have the Given number of students = 40
∴ Ʃf = 35+a+b = 40 a+b = 40-35 = 5 a = 5-b ……(i)
Mean = Ʃfx/Ʃf
As we have Given mean = 7.2
∴( 246+6a+9b) /40 = 7.2
∴( 246+6a+9b)= 40×7.2
∴( 246+6a+9b)= 288
∴6a+9b = 288-246
∴6a+9b = 288-246
∴6a+9b = 42
2a+3b = 14 …..(ii)
When Substitute (i) in (ii)
2(5-b)+3b = 14
10-2b+3b = 14
10+b = 14
∴b = 14-10
= 4
∴a = 5-4
= 1
Therefore , the value of a and b is 1 and 4 respectively.

Mean =Ʃfixi/Ʃfi
=985/41
= 24.024
= 24.02 (approx)
Therefore, the mean of the distribution is 24.02.
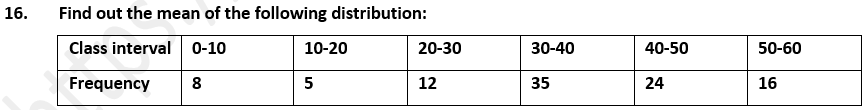
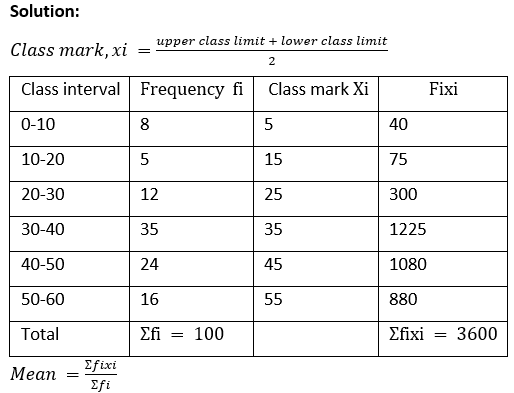
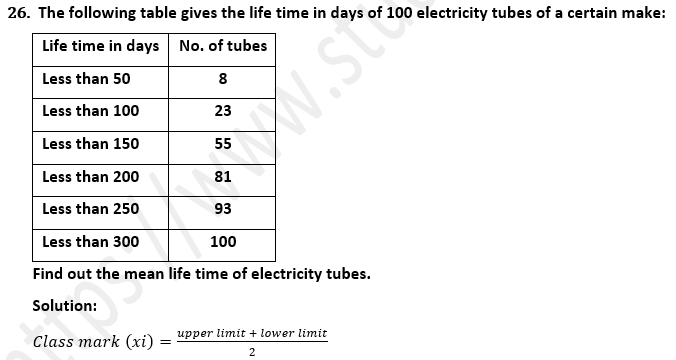
=3600/100
= 36
Therefore, the mean of the distribution is 36.

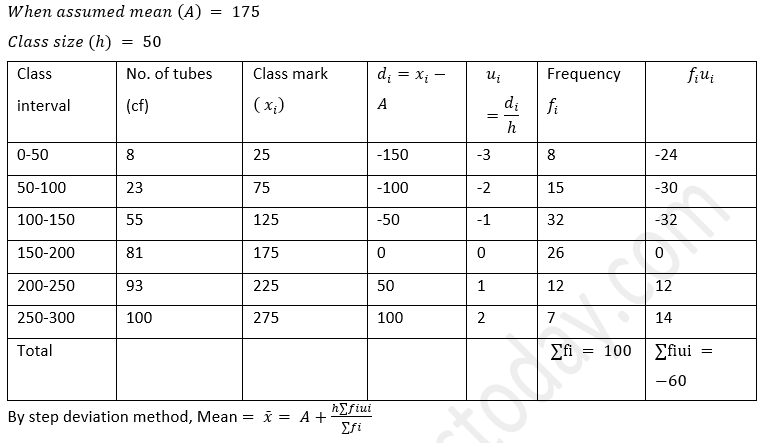
So, Let assumed mean (A) = 25
Class size (h) = 10
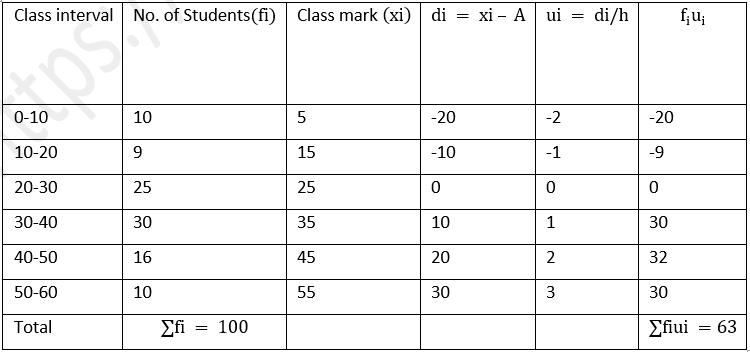
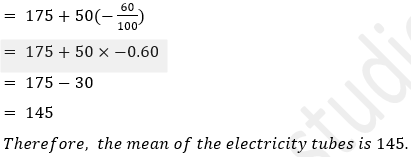
By step deviation method,
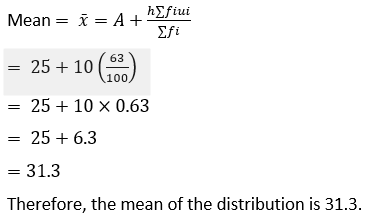
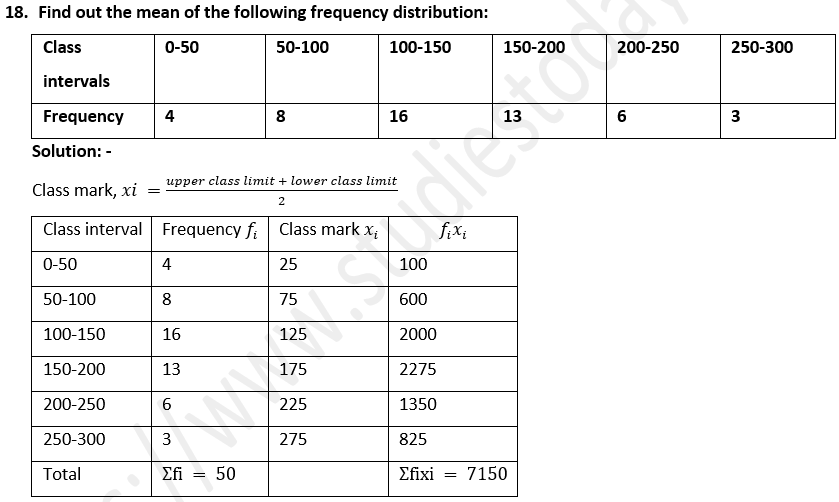
Mean =Ʃfixi/(Ʃfi )
=7150/50
=143
Therefore , the mean of the distribution is 143.
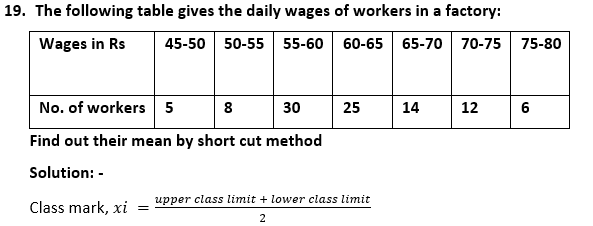
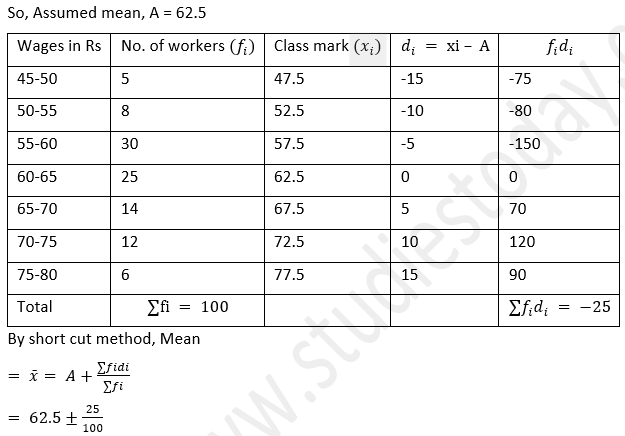
= 62.5-0.25 = 62.25
Therefore, the mean of the distribution is Rs.62.25.
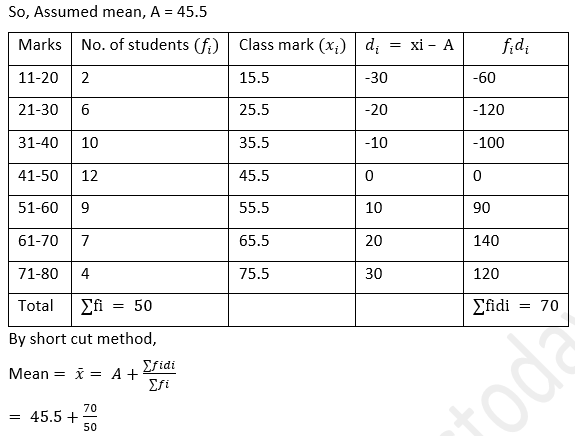
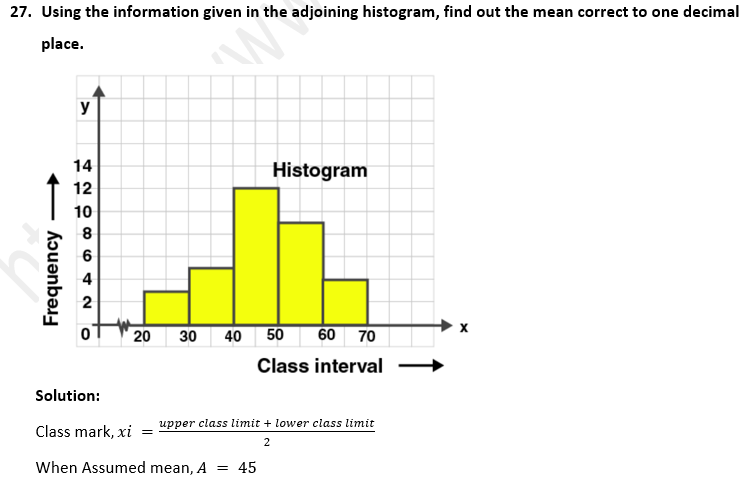
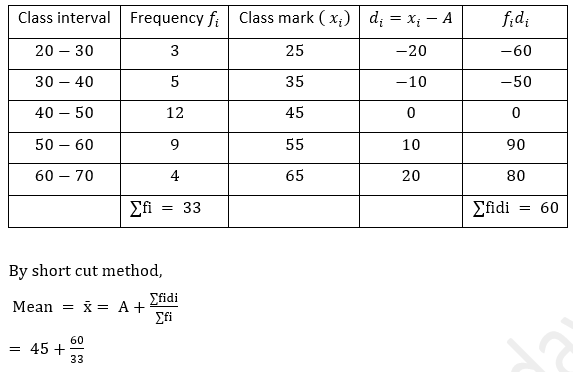
= 45.5+1.4
= 46.9
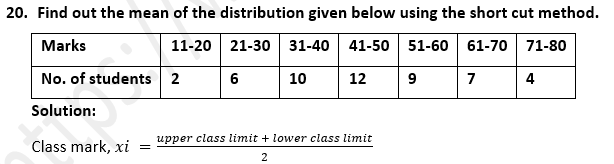
Therefore, the mean of the distribution is Rs.46.9.
21. A class teacher has the following absentee record of 40 students of a class for the whole term. Find out out the mean number of days a student was absent.
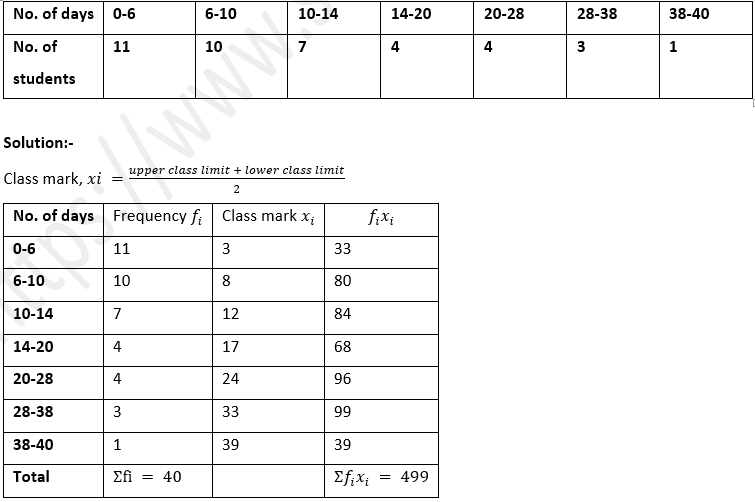
Mean =Ʃfixi/(Ʃfi )
=499/40
=12.475
Therefore, the mean number of days a student was absent is 12.475.
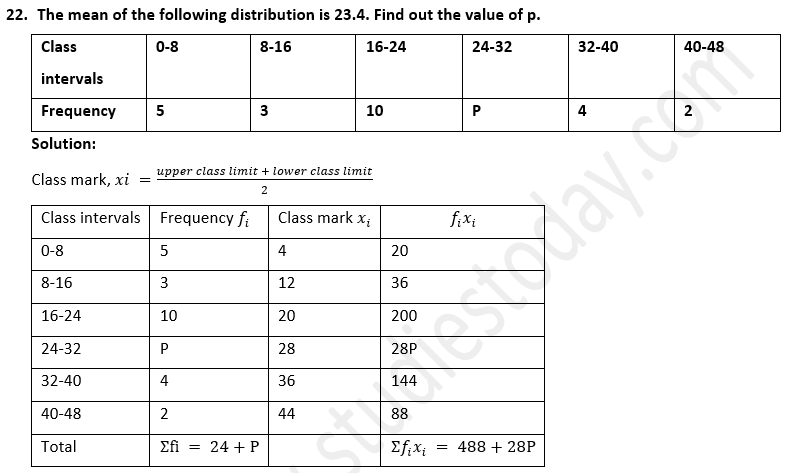
As we have the Given mean = 23.4
∴Mean =Ʃfixi/(Ʃfi )
∴23.4 =(488+28P)/(24+P)
∴23.4×(24+P)= 488+28P
∴561.6+23.4P = 488+28P
∴561.6-488 = 28P -23.4P
73.6 = 4.6 P
∴P = 73.6/4.6 = 16
Therefore, the value of P is 16.

As we have the Given sum of all frequencies, Ʃ fi = 120
∴68+P+q = 120
∴P+q = 120-68 = 52
∴P+q = 52
∴P = 52-q …(i)
As we have Given mean = 50
∴Mean = Ʃfixi/(Ʃ fi )
∴50 =(3480+30P+70q)/120
∴50×120 = 3480+30P+70q
∴6000 = 3480+30P+70q
∴6000- 3480 = 30P+70q
∴2520 = 30P+70q
∴252 = 3P+7q …(ii)
By Substitute (i)in (ii) we get
252 = 3(52-q)+7q
252 = 156-3q+7q
252-156 = 4q
4q = 96
q =96/4
= 24
∴P = 52-24
= 28
Therefore, the value of P and q is 28 and 24 respectively.
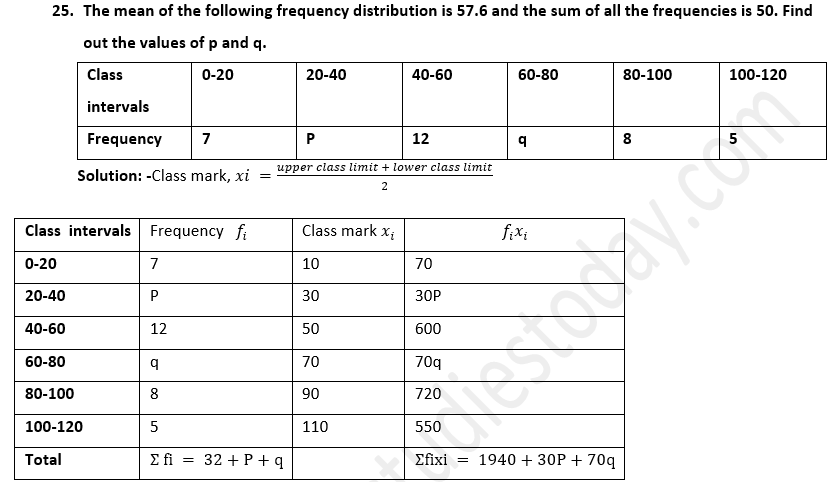
As we have the Given sum of all frequencies, Ʃ fi = 50
∴32+P+q = 50
∴P+q = 50-32= 18
∴P+q = 18 ∴P
= 18-q …(i)
As we have Given mean = 57.6
∴Mean =Ʃfixi/Ʃfi
∴57.6 =(1940+30P+70q)/50
∴57.6 ×50 = 1940+30P+70q
∴2880= 1940+30P+70q
∴2880- 1940 = 30P+70q
∴940 = 30P+70q
∴94 = 3P+7q …(ii)
by Substitute (i)in (ii) , we get
94 = 3(18-q)+7q
94 = 54-3q+7q
94-54= 4q
40 = 4q
q =40/4
= 10
∴P = 18-10 = 8
Therefore, the value of P and q is 8 and 10 respectively.
= 45+1.81
= 46.81
= 46.8 [corrected to one decimal place]
Therefore, the mean is Rs.46.8.
Exercise 21.2
1. A student scored the following marks in 11 questions of a question paper : 3, 4, 7, 2, 5, 6, 1, 8, 2, 5, 7 Find out the median marks.
Solution:
When we Arranging the data in the ascending order
1,2,2,3,4,5,5,6,7,7,8
Here the number of terms, n = 11
Here n is odd.
2. (a) Find out the median of the following set of numbers : 9, 0, 2, 8, 5, 3, 5, 4, 1, 5, 2, 7 (1990) (b)For the following set of numbers, Find out the median: 10, 75, 3, 81, 17, 27, 4, 48, 12, 47, 9, 15.
Solution:
(a) When we Arranging the numbers in ascending order :
0, 1, 2, 2, 3, 4, 5, 5, 5, 7, 8, 9
Here, n = 12 which is even
(b) When we Arranging the numbers in ascending order :
3,4,9,10,12,15,17,27,47,48,75,81
Here, n = 12 which is even
3. Find out the mean and the median of the numbers : 2, 1, 0, 3, 1, 2, 3, 4, 3, 5
Solution:-
When we Arranging the Given numbers in ascending order :
0, 1, 1, 2, 2, 3, 3, 3, 4, 5
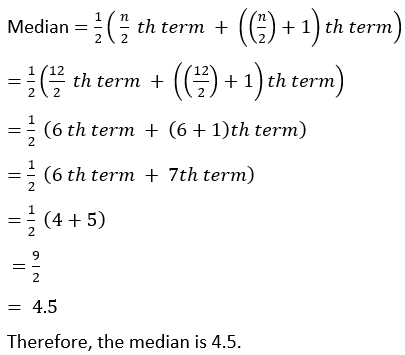
Here, n = 10 which is even
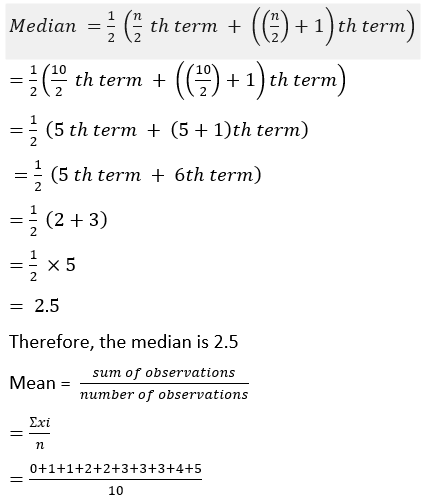
=24/10
= 2.4
Therefore, the mean is 2.4.
4. The median of the observations 11, 12, 14, (x – 2), (x + 4), (x + 9), 32, 38, 47 arranged in ascending order is 24. Find out the value of x and hence Find out the mean.
Solution:
As we have the given Observation are as follows :
11,12,14,(x-2),(x+4),(x+9),32,38,47
n = 9
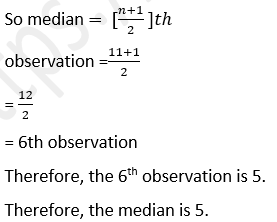
Here n is odd.
So median = ((n+1)/2)th term
=((9+1)/2 )th term
= 5th term
= x+4
As we have Given median = 24
∴x+4 = 24
∴x = 24 -4
= 20
Sum of observations = 11+12+14+(x-2)+(x+4)+(x+9)+32+38+47 = 165+3x
Substitute x= 20
Sum of observations = 165+3×20
= 165+60
= 225
Mean =(Sum of observations )/(number of observations )
=225/9
= 25
Therefore ,the value of x is 20 and mean is 25.
5. The mean of the numbers 1, 7, 5, 3, 4, 4, is m. The numbers 3, 2, 4, 2, 3, 3, p have mean m-1 and median q.
Find out
(i) p
(ii) q
(iii) the mean of p and q
Solution:
(i) Mean of the Given numbers 1,7,5,3,4,4 is m.
Here n = 6
∴Mean, m =(1+7+5+3+4+4)/6
∴m =24/6
∴m = 4
As Given the numbers 3,2,4,2,3,3,p have mean m-1.
So m-1 =(3+2+4+2+3+3+p)/7
∴4-1 =(17+p)/7
∴3 =(17+p)/7
∴3×7 = 17+p
∴21 = 17+p
∴p = 21-17
∴p = 4
Therefore, the value of p is 4.
(ii) As we have the Median of the Given numbers q.
When we Arranging them in ascending order
2,2,3,3,3,4,4
Here n = 7 which is odd
So median = ((n+1)/2)th term
q = ((7+1)/2 )th term
q = (8/2 )th term
q = 4th term
q = 3
So value of q is 3.
(iii)mean of p and q
=(p+q)/2
=(4+3)/2
=7/2 = 3.5
Therefore, the mean of p and q is 3.5.
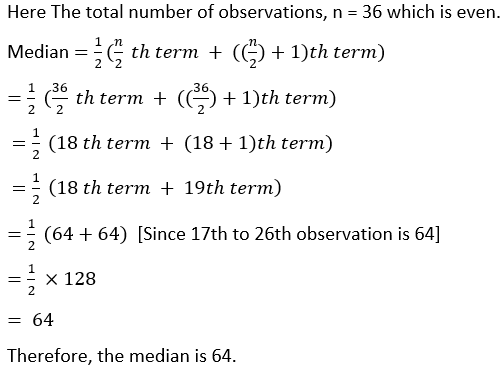
Here the total number of observations,
n = 47 which is odd.
So median
=(( n+1)/2)th term
= ((47+1)/2 )th term
= (48/2 )th term
= 24th term = 48 [Since 23rd to 29th observation is 48]
Therefore, the median is 48.


10. The daily wages in (rupees of) 19 workers are
41,21,38,27,31,45,23,26,29,30,28,25,35,42,47,53,29,31,35.
Find out :
(i) the median
(ii) lower quartile
(iii) upper quartile
(iv) inter quartile range
Solution:
When we Arranging the given observations in ascending order
21,23,25,26,27,28,29,29,30,31,31,35,35,38,41,42,45,47,53
Here n = 19 which is odd.
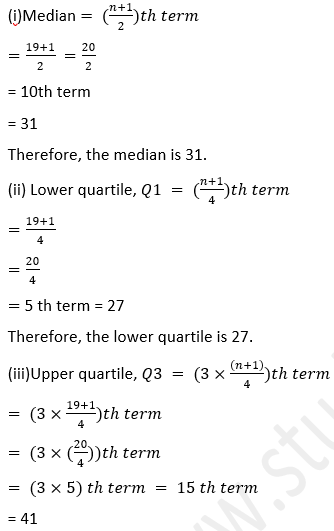
(i)Median = ((n+1)/2)th term
=(19+1)/2 =20/2
= 10th term
= 31
Therefore, the median is 31.
(ii) Lower quartile, Q1 = ((n+1)/4)th term
=(19+1)/4
=20/4
= 5 th term = 27
Therefore, the lower quartile is 27.
(iii)Upper quartile, Q3 = (3×((n+1))/4)th term
= (3×(19+1)/4)th term
= (3×(20/4))th term
= (3×5) th term = 15 th term
= 41
Therefore, the upper quartile is 41.
(iv)Interquartile range
= Q3-Q1
= 41-27
= 14
Therefore,the Interquartile range is 14.
Therefore, the upper quartile is 41.
(iv)Interquartile range
= Q3-Q1
= 41-27
= 14
Therefore,the Interquartile range is 14.
11. From the following frequency distribution,
Find out :
(i) the median
(ii) lower quartile
(iii) upper quartile
(iv) inter quartile range
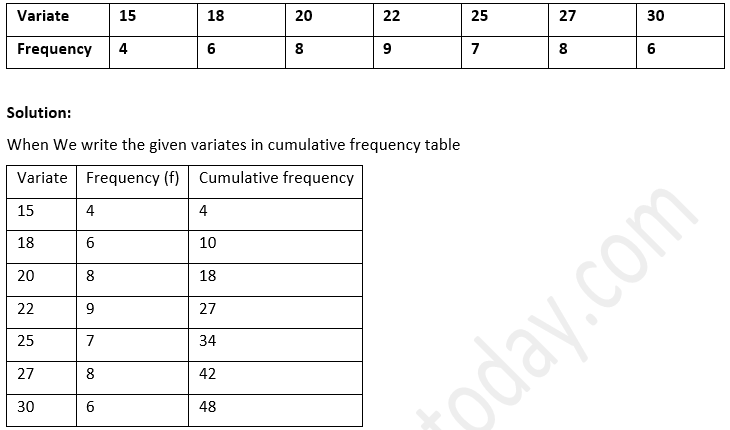

(ii) Lower quartile, Q1
= (48)/4
= 12 th term
= 20
Therefore, the lower quartile is 20.

Therefore, the upper quartile is 27
(iv) Interquartile range = Q3-Q1
= 27-20 = 7
Hence the Interquartile range is 7.
12. For the following frequency distribution,
Find out :
(i) the median
(ii) lower quartile
(iii) upper quartile
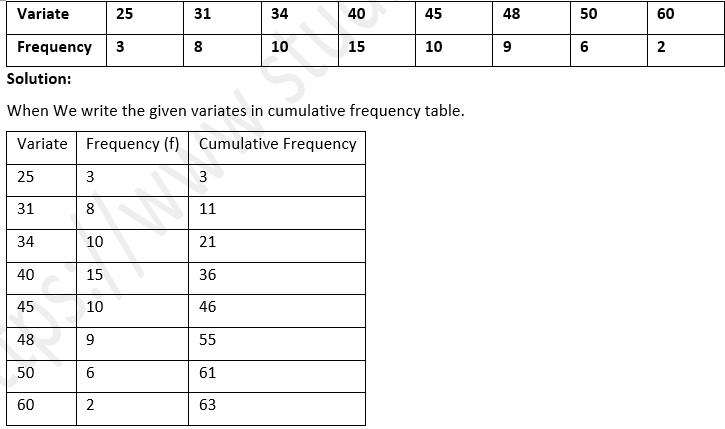
(i) Here the number of observations,
n = 63
which is odd.
Median = ((n+1)/2)th term
=(63+1)/2
=64/2
= 32th term
= 40
Therefore, the median is 40.
(ii) Lower quartile,
= ((n+1)/4)th term
=(63+1)/4
=64/4
= 16 th term
= 34
Therefore, the lower quartile is 34.
(iii)Upper quartile,
= (3(n+1)/4)th term
= (3×(63+1)/4)th term
= (3×(64/4))th term
= (3×16) th term
= 48 th term
= 48
Therefore, the upper quartile is 48.
Exercise 21.3
1. Find out the mode of the following sets of numbers ;
(i) 3, 2, 0, 1, 2, 3, 5, 3
(ii) 5, 7, 6, 8, 9, 0, 6, 8, 1, 8
(iii) 9, 0, 2, 8, 5, 3, 5, 4, 1, 5, 2, 7
Solution:
Mode is the given number which appears most often in a set of numbers.
(i) As we have the Given set is 3, 2, 0, 1, 2, 3, 5, 3.
In this set,
3 occurs maximum number of times.
Therefore, the mode is 3.
(ii) As we have the Given set is 5, 7, 6, 8, 9, 0, 6, 8, 1, 8.
In this set,
8 occurs maximum number of times.
Therefore, the mode is 8.
(iii) As we have the Given set is 9, 0, 2, 8, 5, 3, 5, 4, 1, 5, 2, 7.
In this set, 5
occurs maximum number of times.
Therefore, the mode is 5.
2. Find out the mean, the median and the mode of the numbers : 3, 2, 6, 3, 3, 1, 1, 2
Solution:
When We arrange the given data in ascending order 1, 1, 2, 2, 3, 3, 3, 6
Mean = Ʃxi/n
= (1+1+2+2+3+3+3+6)/8
= 21/8
= 2.625
Therefore, the mean is 2.625.
Here in the given number of observations,
n = 8 which is even.
So median
Therefore, the median is 2.5
In the given set, 3 occurs maximum number of times.
Therefore, the mode is 3.
3. Find out the mean, median and mode of the following distribution : 8, 10, 7, 6, 10, 11, 6, 13, 10
Solution:
When We arrange the given data in ascending order 6, 6, 7, 8, 10, 10, 10, 11, 13
Mean =Ʃxi/n
=(6+6+7+8+10+10+10+11+13)/9
=81/9
= 9
Therefore, the mean is 9.
Here number of observations,
n = 9 which is odd.
Median = ((n+1)/2)th term
=(9+1)/2
=10/2
= 5th term = 10
Therefore, the median is 10.
In the given set, 10 occurs maximum number of times.
Hence the mode is 10.
4. Find out the mean, the median and the mode of the following numbers : 3, 1, 5, 6, 3, 4, 5, 3, 7, 2
Solution:
When We arrange the given data in ascending order 1, 2, 3, 3, 3, 4, 5, 5, 6, 7
Mean =Ʃxi/n
=(1+2+3+3+3+4+5+5+6+7)/10
=39/10
= 3.9
Therefore, number of observations,
n = 10 which is even.
Therefore, the median is 3.5.
In the given set, 3 occurs maximum number of times.
Therefore, the mode is 3.
5.The marks of 10 students of a class in an examination arranged in ascending order are as follows: 13,35,43,46,x,x +4,55,61,71,80
If the median marks is 48, Find out the value of x. Hence, Find out the mode of the given data.
Solution:
When we arrange the Given data in ascending order: 13,35,43,46,x,x +4,55,61,71,80
Given median = 48
Number of observations,
n = 10 which is even.
48 =x+2
∴x = 48-2 = 46
∴x+4
= 46+4 = 50
So the distribution becomes 13,35,43,46,46,50,55,61,71,80
Here 46 occurs maximum number of times.
Therefore, the mode is 46
6. A boy scored the following marks in various class tests during a term each test being marked out of 20: 15, 17, 16, 7, 10, 12, 14, 16, 19, 12, 16
(i) What are his modal marks ?
(ii) What are his median marks ?
(iii) What are his mean marks ?
Solution:
(i) When We arrange the given marks in ascending order 7, 10, 12, 12, 14, 15, 16, 16, 16, 17, 19
16 appears maximum number of times.
Therefore, his modal mark is 16.
(ii)Here number of observations,
n = 11 which is odd.
So Median = ((n+1)/2)th term
=(11+1)/2
=12/2
= 6th term
= 15
Therefore, the median is 15
(iii) Mean =Ʃxi/n
=( 7+ 10+12+12+14+ 15+16+16+16+ 17+ 19)/11
= 154/11
= 14
Therefore, the mean is 14.
7. Find out the mean, median and mode of the following marks obtained by 16 students in a class test marked out of 10 marks : 0, 0, 2, 2, 3, 3, 3, 4, 5, 5, 5, 5, 6, 6, 7, 8
Solution:
As we have the Given data is 0, 0, 2, 2, 3, 3, 3, 4, 5, 5, 5, 5, 6, 6, 7, 8
Number of observations, n = 16
= 4.5
Therefore, the median is 4.5.
Here 5 appears maximum number of times.
Therefore , mode is 5.
8. Find out the mode and median of the following frequency distribution :
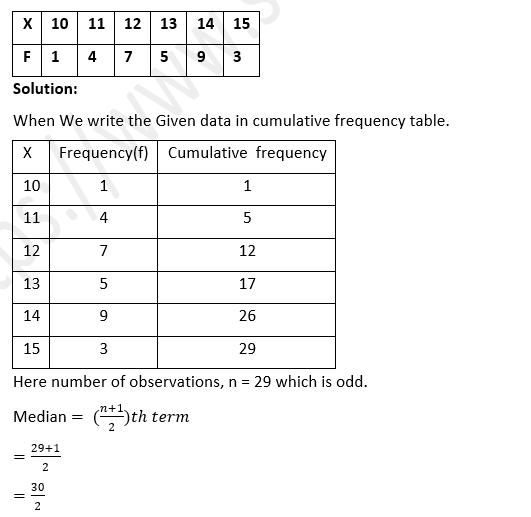
= 15th term
= 13
Therefore , the median is 13.
Therefore , the frequency corresponding to 14 is maximum.
Therefore.the mode is 14.
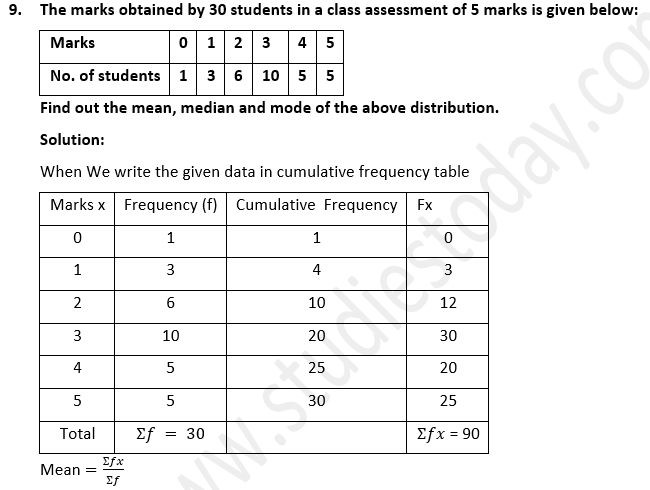
=90/30 = 3
Therefore, the mean is 3.
Here number of observations,
n = 30 which is even.
So median
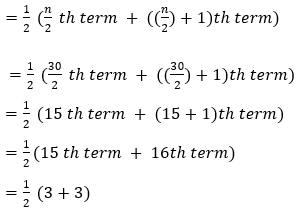
=6/2
= 3
Therefore the median is 3.
Here the mark 3 occurs maximum number of times.
Therefore, the mode is 3.
10. The distribution given below shows the marks obtained by 25 students in an aptitude test. Find out the mean, median and mode of the distribution.
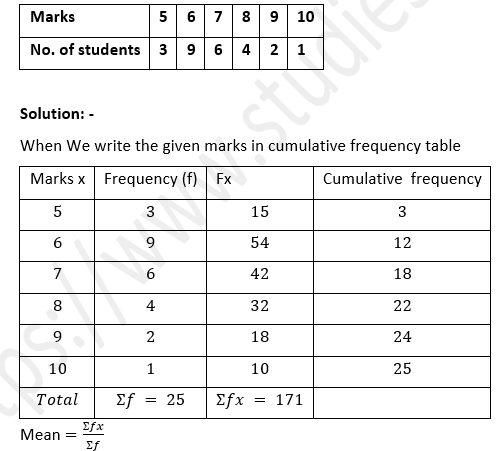
=171/25
= 6.84
Therefore, the mean is 6.84.
Here number of observation, n = 25 which is odd.
Median = ((n+1)/2)th term
=(25+1)/2
=26/2
= 13th term
= 7
Therefore, the median is 7.
Here the frequency corresponding to 6 is maximum.
Therefore, the mode is 6.
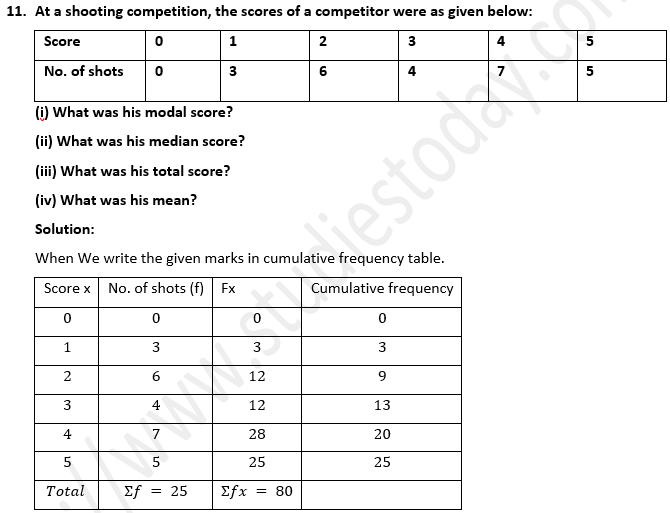
(i) Here the frequency corresponding to 4 is maximum. 4 occurs 7 times.
Therefore, his modal score is 4.
(ii)Here number of observation,
n = 25 which is odd.
Median = ((n+1)/2)th term
=(25+1)/2
=26/2
= 13th term
= 3
Therefore, his median score is 3.
(iii)Total score = Ʃfx
= 80
Therefore, his total score is 80.
(iv)Mean =Ʃfx/Ʃf
=80/25
= 3.2
Therefore, his mean score is 3.2.
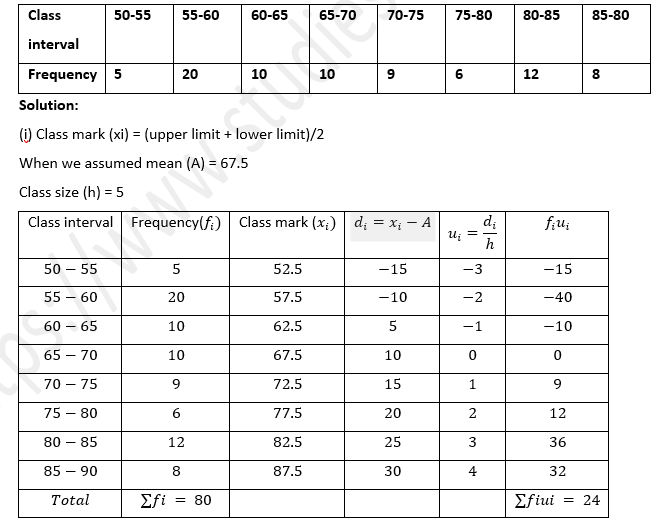
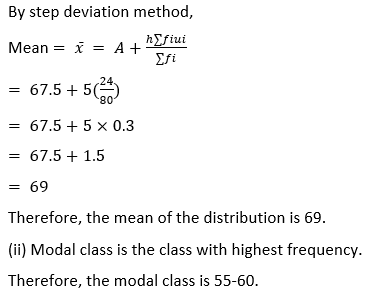
12. (i) Using step-deviation method, Find out the mean marks of the following distribution. (ii) State the modal class.
13. The following table gives the weekly wages (in Rs.) of workers in a factory :
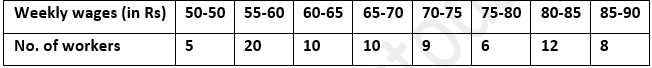
Find out:
(i) The mean.
(ii) the modal class
(iii) the number of workers getting weekly wages below Rs. 80.
(iv) the number of workers getting Rs. 65 or more but less than Rs. 85 as weekly wages.
Solution:
When We write the given data in cumulative frequency table
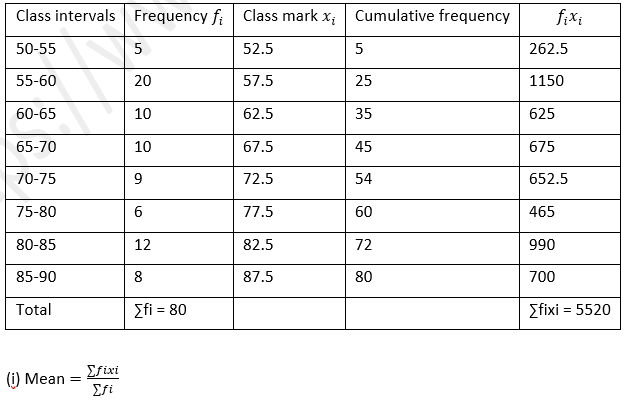
=5520/80
= 69
Therefore, the mean is 69.
(ii) Modal class is the class with highest frequency.
Therefore, the modal class is 55-60.
(iii) The number of workers getting weekly wages below Rs. 80 is 60.
[Check the cumulative frequency column and class interval column. 60 workers get below Rs. 80]
(iv) The number of workers getting Rs. 65 or more but less than Rs. 85 as weekly wages
= 72-35 = 37
[Check the cumulative frequency column and class interval column.
Exercise 21.4
1. Draw a histogram for the following frequency distribution and Find out the mode from the graph :

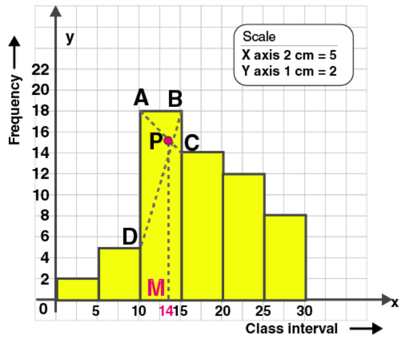
In the highest rectangle, draw two straight lines AC and BD.
P is the point of intersection.
Draw a vertical line through P to meet the X-axis at M.
The abscissa of M is 14.
Therefore, the mode is 14.
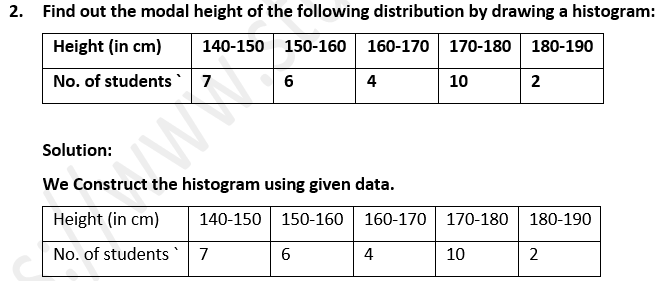
Represent height on X-axis and number of students on Y-axis.
Take scale: X axis : 2 cm = 10 (class interval)
Y axis : 1 cm = 1 (frequency)
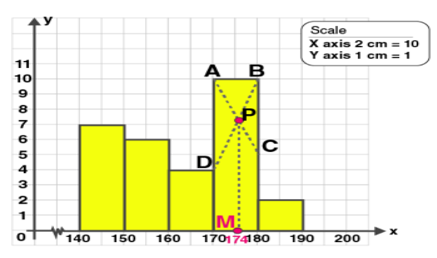
In the highest rectangle, draw two straight lines AC and BD.
P is the point of intersection.
Draw a vertical line through P to meet the X-axis at M.
The abscissa of M is 174.
Therefore, the mode is 174.
Represent marks on X-axis and number of students on Y-axis.
Take scale: X axis : 2 cm = 10 (class interval)
Y axis : 1 cm = 1 (frequency)
In the highest rectangle, draw two straight lines AC and BD.
P is the point of intersection.
Draw a vertical line through P to meet the X-axis at M.
The abscissa of M is 82.5.
Therefore, the mode is 82.5.
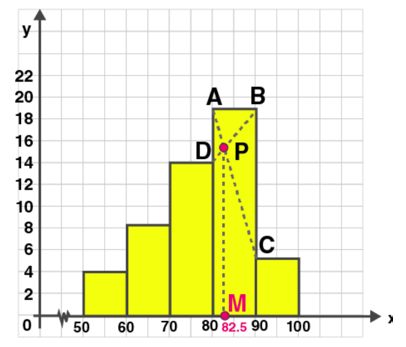
Represent classes on X-axis and frequency on Y-axis.
Take scale: X axis : 2 cm = 10 (class interval)
Y axis : 1 cm = 1 (frequency)
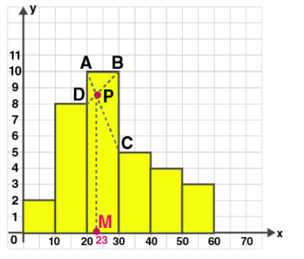
In the highest rectangle, draw two straight lines AC and BD.
P is the point of intersection.
Draw a vertical line through P to meet the X-axis at M.
The abscissa of M is 23.
Therefore, the mode is 23
5. IQ of 50 students was recorded as follows.
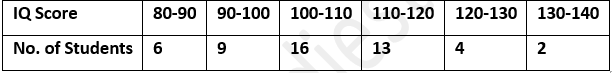
Draw a histogram for the above data and estimate the mode.
Solution:
When we Construct the histogram using given data.
Represent classes on X-axis and frequency on Y-axis.
Take scale: X axis : 1 cm = 10 (class interval)
Y axis : 1 cm = 1 (frequency)
In the highest rectangle, draw two straight lines AB and CD.
M is the point of intersection.
Draw a vertical line through M to meet the X-axis at L.
The abscissa of L is 107.
Therefore, the mode is 107.
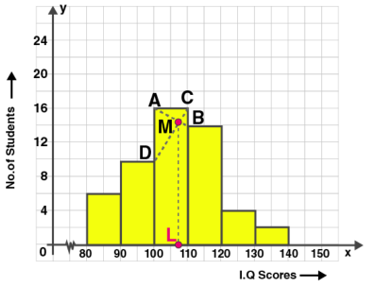
6. Use a graph paper for this question. The daily pocket expenses of 200 students in a school are given below:

Draw a histogram representing the above distribution and estimate the mode from the graph.
Solution:
When we Construct the histogram using given data.
Represent classes on X-axis and frequency on Y-axis.
Take scale: X axis : 2 cm = 5 (class interval)
Y axis : 1 cm = 5 (frequency)
In the highest rectangle, draw two straight lines AC and BD.
P is the point of intersection.
Draw a vertical line through P to meet the X-axis at M.
The abscissa of M is 21.
Therefore, the mode is 21.
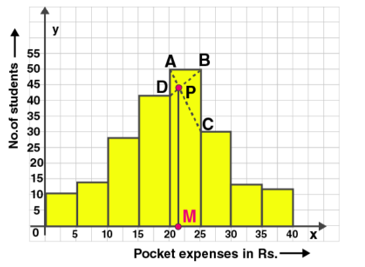
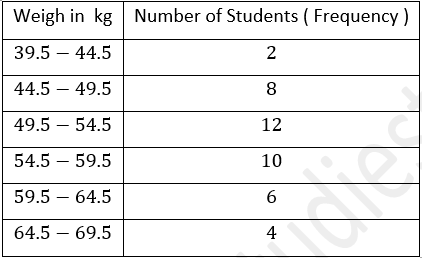
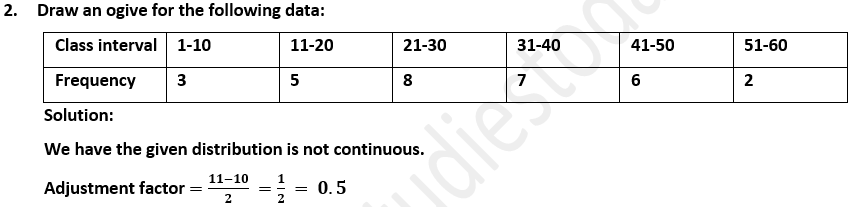
7. Draw a histogram for the following distribution :

Solution:
When The given distribution is not continuous.
Adjustment factor =(45-44)/2 =1/2 = 0.5
We subtract 0.5 from lower limit of the class interval and add 0.5 to upper limit.
So the new table in continuous form is given below.
Construct the histogram using given data.
Represent weight on X-axis and no. of students on Y-axis.
Take scale: X axis : 2 cm = 5 (class interval)
Y axis : 1 cm = 1 (frequency)
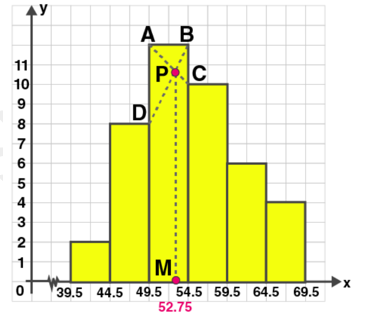
In the highest rectangle, draw two straight lines AC and BD.
P is the point of intersection.
Draw a vertical line through P to meet the X-axis at M.
The abscissa of M is 52.75.
Therefore, the mode is 52.75.
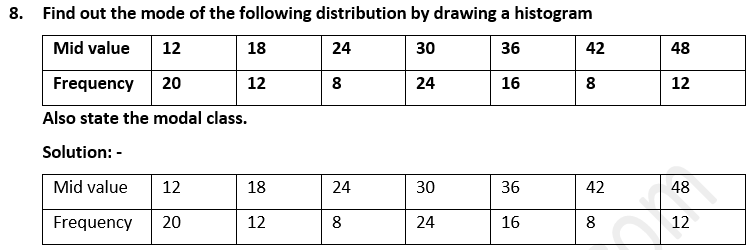
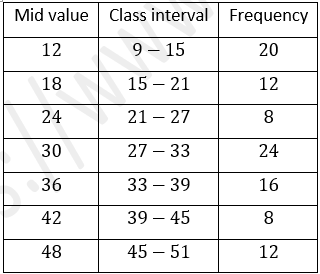
Here mid value and frequency is given.
We can Find out the class size, h by subtracting second mid value from first mid value. ∴h = 18-12 = 6
So to Find out the lower limit of class interval,
When we subtract h/2 to the mid value.
To Find out the upper limit of class interval, we add h/2 to the mid value.
Here h/2 = 6/2 = 3
So lower limit = 12-3 = 9
Upper limit = 12+3 = 15
So the class interval is 9-15
Likewise we Find out the class interval of other values.
Construct the histogram using given data.
Take scale: X axis : 2 cm = 6 (class interval)
Y axis : 1 cm = 2 (frequency)
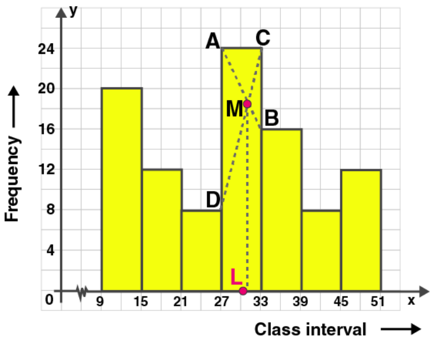
In the highest rectangle, draw two straight lines AB and CD.
M is the point of intersection.
Draw a vertical line through M to meet the X-axis at L.
The abscissa of L is 30.5.
Therefore, the mode is 30.5.
Modal class is the class with highest frequency.
Therefore, the modal class is 27-33.
Exercise 21.5
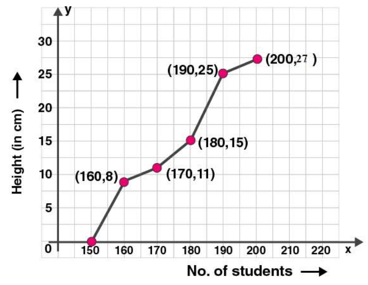
1. Draw an ogive for the following frequency distribution:
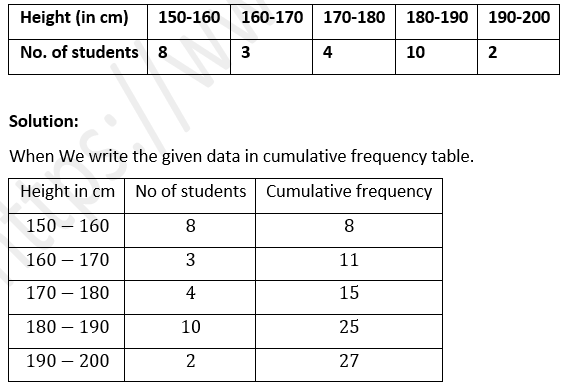
To represent the data in the table graphically, we mark the upper limits of the class intervals on the horizontal axis (x-axis) and their corresponding cumulative frequencies on the vertical axis ( y-axis).
Plot the points (160, 8), (170, 11), (180, 15), (190, 25) and (200, 27) on the graph.
Join the points with the free hand. We get an ogive as shown:
We subtract 0.5 from lower limit of the class interval and add 0.5 to upper limit.
So the new table in continuous form is given below.
When We write the given data in cumulative frequency table.
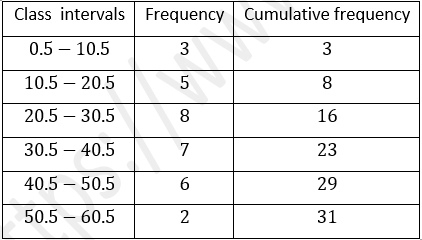
To represent the data in the table graphically, we mark the upper limits of the class intervals on the horizontal axis (x-axis) and their corresponding cumulative frequencies on the vertical axis ( y-axis).
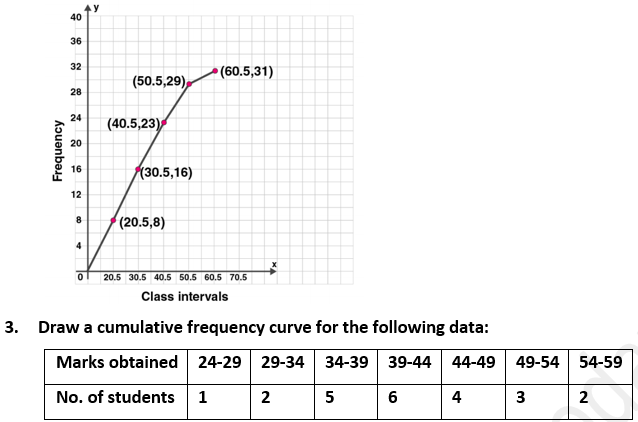
Plot the points (10.5, 3), (20.5, 8), (30.5, 16), (40.5, 23) , (50.5, 29) and (60.5, 31) on the graph. Join the points with the free hand. We get an ogive as shown:
Solution:-
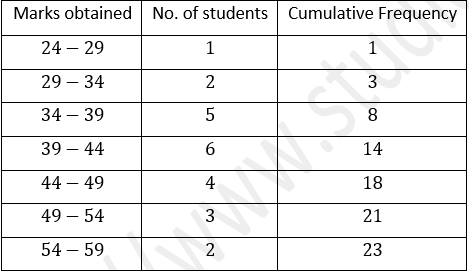
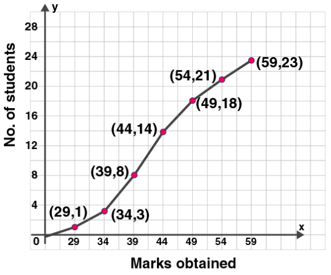
When We write the given data in cumulative frequency table.
To represent the data in the table graphically, we mark the upper limits of the class intervals on the horizontal axis (x-axis) and their corresponding cumulative frequencies on the vertical axis ( y-axis).
Plot the points (29, 1), (34, 3), (39, 8), (44, 14), (49, 18) , (54, 21) and (59, 23) on the graph.
Join the points with the free hand. Therefore, we get an ogive as shown:
Exercise 21.6
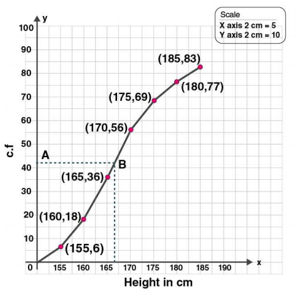
1. The following table shows the distribution of the heights of a group of a factory workers.
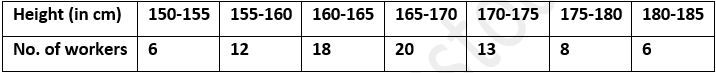
(i) Determine the cumulative frequencies.
(ii) Draw the cumulative frequency curve on a graph paper. Use 2 cm = 5 cm height on one axis and 2 cm = 10 workers on the other.
(iii) From your graph, write down the median height in cm.
Solution:-
(i) When We write the given data in cumulative frequency table
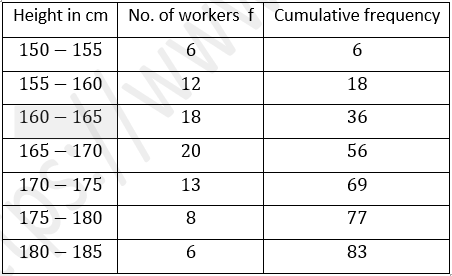
(ii) Plot the points (155, 6), (160, 18), (165, 36), (170, 56), (175, 69), (180, 77) and (185, 83) on the graph. Join the points with the free hand. Therefore, We get an ogive as shown:
(iii)Here n = 83 , which is odd.
So median = ((n+1)/2 )th observation
= ((83+1)/2)th observation
= (84/2)th observation
= 42th observation
Take a point A(42) on Y-axis. From A, draw a horizontal line parallel to X-axis meeting the curve at B. From B draw a line perpendicular on the x-axis which meets it at C.
∴C is the median which is 166.5 cm.
To represent the data in the table graphically, we mark the upper limits of the class intervals on the horizontal axis (x-axis) and their corresponding cumulative frequencies on the vertical axis ( y-axis),
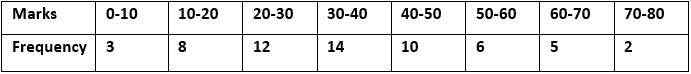
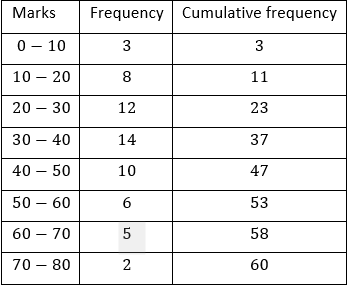
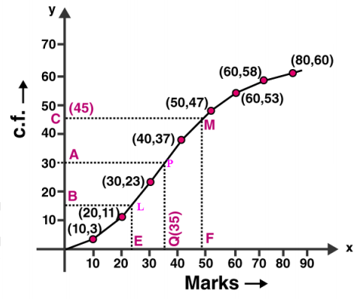
Plot the points (10, 3), (20, 11), (30, 23), (40, 37), (50, 47), (60, 53), (70, 58) and (80, 60) on the graph. Join the points with the free hand. Therefore, get an ogive as shown:

Here number of observations, n = 60 which is even.
So median = (n/2) th term
= (60/2 th term
= 30 th term
Mark a point A(30) on Y-axis. From A, draw a horizontal line parallel to X-axis meeting the curve at P. From P draw a line perpendicular on the x-axis which meets it at Q.
∴Q is the median .
Q = 35
Hence the median is 35 .
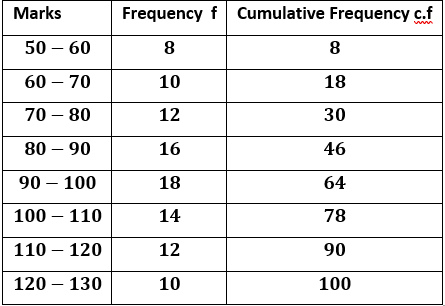
3. Use graph paper for this question. The following table shows the weights in gm of a sample of 100 potatoes taken from a large consignment:
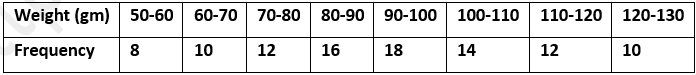
(i) Find out the cumulative frequencies.
(ii) Draw the cumulative frequency curve and from it determine the median weight of the potatoes.
Solution:
(i) When We write the given data in cumulative frequency table.
(ii) To represent the data in the table graphically, we mark the upper limits of the class intervals on the horizontal axis (x-axis) and their corresponding cumulative frequencies on the vertical axis ( y-axis),
Plot the points (60, 8), (70, 18), (80, 30), (90, 46), (100, 64), (110, 78), (120, 90) and (130, 100) on the graph. Join the points with the free hand.
Therefore, We get an ogive as shown:
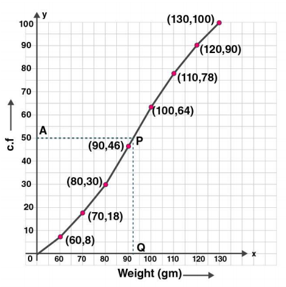
Here n = 100 which is even.
So median = (n/2 th term)
= (100/2 th term)
= (50 th term)
Now mark a point A (50) on the Y-axis and from A draw a line parallel to X-axis meeting the curve at P. From P, draw a perpendicular on x-axis meeting it at Q.
Q is the median.
Q = 93 gm.
Therefore, the median is 93.
4. Attempt this question on graph paper.
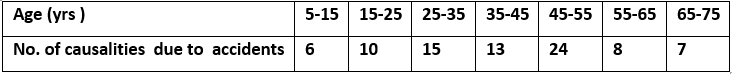
(i) Construct the ‘less than’ cumulative frequency curve for the above data, using 2 cm = 10 years, on one axis and 2 cm = 10 casualties on the other.
(ii) From your graph determine
(1) the median and (2) the upper quartile
Solution:-
(i) When We write the given data in cumulative frequency table.
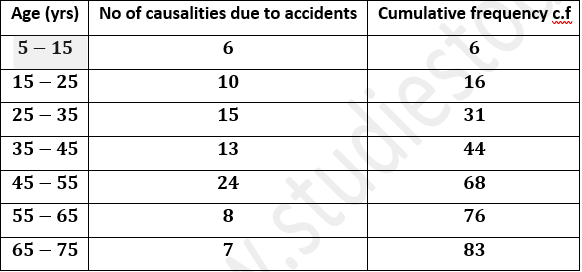
(ii)To represent the data in the table graphically, we mark the upper limits of the class intervals on the horizontal axis (x-axis) and their corresponding cumulative frequencies on the vertical axis ( y-axis),
Plot the points (15, 6), (25, 16), (35, 31), (45, 44), (55, 68), (65, 76) and (75, 83) on the graph. Join the points with the free hand.Therefore, We get an ogive as shown:
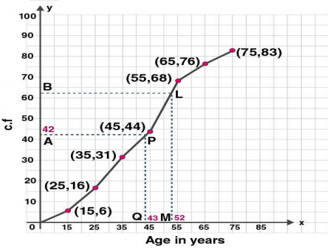
(ii)(1). Here n = 83, which is odd.
So median =(n+1)/2 th term
= ((83+1)/2)
=84/2 = 42
Now mark a point A (42) on the Y-axis and from A draw a line parallel to X-axis meeting the curve at P. From P, draw a perpendicular on x-axis meeting it at Q.
Q is the median.
Q = 43
Therefore, the median is 43.
(ii)(2). Upper quartile = (3(n+1)/4)
= (3×(83+1)/4)
= (3×84/4)
= 63
Now mark a point B (63) on the Y-axis and from A draw a line parallel to X-axis meeting the curve at L. From L, draw a perpendicular on x-axis meeting it at M.
M = 52
Therefore, the upper quartile is 52
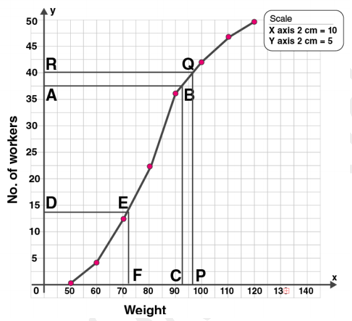
5. The weight of 50 workers is given below:
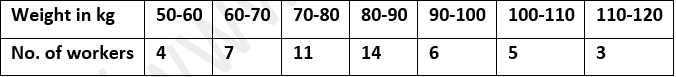
Draw an ogive of the given distribution using a graph sheet. Take 2 cm = 10 kg on one axis , and 2 cm = 5 workers along the other axis.
Use a graph to estimate the following:
(i) the upper and lower quartiles.
(ii) if weighing 95 kg and above is considered overweight Find out the number of workers who are overweight.
Solution:
When We write the given data in cumulative frequency table.

To represent the data in the table graphically, we mark the upper limits of the class intervals on the horizontal axis (x-axis) and their corresponding cumulative frequencies on the vertical axis ( y-axis),
Plot the points (60, 4), (70, 11), (80, 22), (90, 36), (100, 42), (110, 47) and (120, 50) on the graph. Join the points with the free hand.Therefore, We get an ogive as shown:
(i) Here n = 50, which is even.
Upper quartile =3n/4
= 3×50/4
= 150/4
= 37.5
Now mark a point A (37.5) on the Y-axis and from A draw a line parallel to X-axis meeting the curve at B. From B, draw a perpendicular on x-axis meeting it at C.
C = 92.5
Therefore, the upper quartile is 92.5 kg.
Lower quartile, Q1 = (n/4)th term
=50/4
= 12.5
Now mark a point D(12.5) on the Y-axis and from D draw a line parallel to X-axis meeting the curve at E. From E, draw a perpendicular on x-axis meeting it at F.
F = 72
Therefore, the lower quartile is 72 kg.
(ii) Mark on the graph point P which is 95 kg on X axis.
Through P draw a vertical line to meet the ogive at Q. Through Q, draw a horizontal line to meet y-axis at R.
The ordinate of point R represents 40 workers on the y-axis .
∴The number of workers who are 95 kg and above = Total number of workers – number of workers of weight less than 95 kg = 50-40 = 10
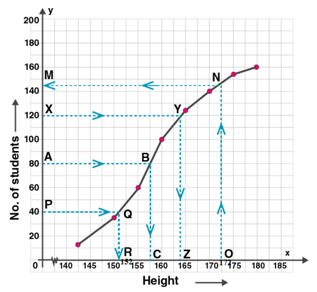
6. The table shows the distribution of scores obtained by 160 shooters in a shooting competition. Use a graph sheet and draw an ogive for the distribution. (Take 2 cm = 10 scores on the x-axis and 2 cm = 20 shooters on the y-axis)
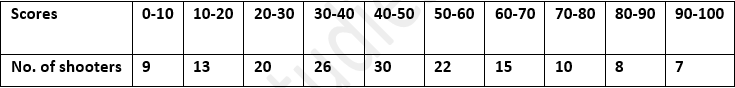
Use your graph to estimate the following:
(i) The median.
(ii) The interquartile range.
(iii) The number of shooters who obtained a score of more than 85%.
Solution:
When We write the given data in cumulative frequency table.
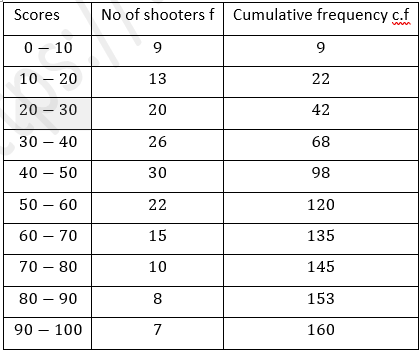
To represent the data in the table graphically, we mark the upper limits of the class intervals on the horizontal axis (x-axis) and their corresponding cumulative frequencies on the vertical axis ( y-axis),
Plot the points (10, 9), (20, 22), (30, 42), (40, 68), (50, 98), (60, 120), (70, 135), (80, 145), (90, 153) and (100, 160) on the graph.
Join the points with the free hand. Therefore, We get an ogive as shown:

(i) Here n = 160, which is even.
So median =n/2 = 80
Now mark a point A(80) on the Y-axis and from A draw a line parallel to X-axis meeting the curve at B. From P,
draw a perpendicular on x-axis meeting it at C.
C is the median.
Therefore, C = 44
(ii) lower quartile, Q1 = (n/4)th term
=160/4
= 40
Now mark a point D(40) on the Y-axis and from that point draw a line parallel to X-axis meeting the curve at E. From E, draw a perpendicular on x-axis meeting it at F.
F = 29
So Q1= 29
Upper quartile, Q3 = (3n/4)th term
= 3×160/4
= 3×40
= 120
Mark a point P(120) on the Y-axis and from that point draw a line parallel to X-axis meeting the curve at Q. From Q, draw a perpendicular on x-axis meeting it at R.
R = 60
So Q3 = 60
Inter quartile range = Q3- Q1
= 60-29 = 31
Therefore, the Inter quartile range is 31.
(iii) Mark a point Z(85) on the X axis.
From Z on X-axis, draw a perpendicular to it meeting the curve at Y. From Y, draw a line parallel to X-axis meeting Y-axis at X. X is the required point which is 150.
Number of shooters getting more than 85% scores = Total number of shooters - number of shooters who got till
85% = 160-150 = 10.
Therefore, the number of shooters getting more than 85% scores is 10.
7. The daily wages of 80 workers in a project are given below
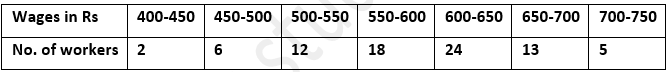
Use a graph paper to draw an ogive for the above distribution. ( a scale of 2 cm = Rs 50 on x- axis and 2 cm = 10 workers on y-axis). your ogive to estimate
(i) the median wage of the workers.
(ii) the lower quartile wage of the workers.
(iii) the number of workers who earn more than Rs 625 daily.
Solution:
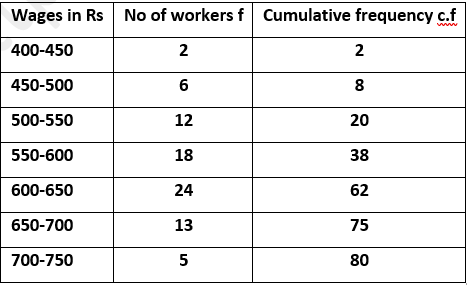
When We write the given data in cumulative frequency table
To represent the data in the table graphically, we mark the upper limits of the class intervals on the horizontal axis (x-axis) and their corresponding cumulative frequencies on the vertical axis ( y-axis),
Plot the points (450, 9), (500, 22), (550, 42), (600, 68), (650, 98), (700, 120) and (750, 135) on the graph. Join the points with the free hand. Therefore, Therefore We get an ogive as shown:
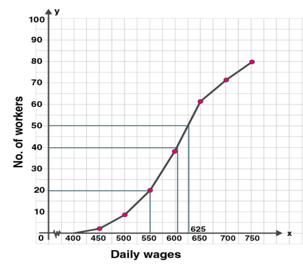
(i)Here n = 80.
Median = (n/2)th term
=80/2
= 40th term
Mark a point (40) on Y axis. Draw a line from that point parallel to X axis. Let it meet the curve at A.
Draw a perpendicular from A to meet X axis at B.
The value of B is 604.
Therefore the median is 604.
(ii)Lower quartile, Q1 = (n/4)th term
=80/4
= 20th term
= 550 [from graph]
(iii) Draw a vertical line through the point 625 on X axis. which meets the graph at point C. From C, draw a horizontal line which meets the y-axis at the mark of 50.
Therefore,, number of workers that earn more Rs 625 daily = Total no. of workers - no. of workers who earn upto 625 = 80-50 = 30
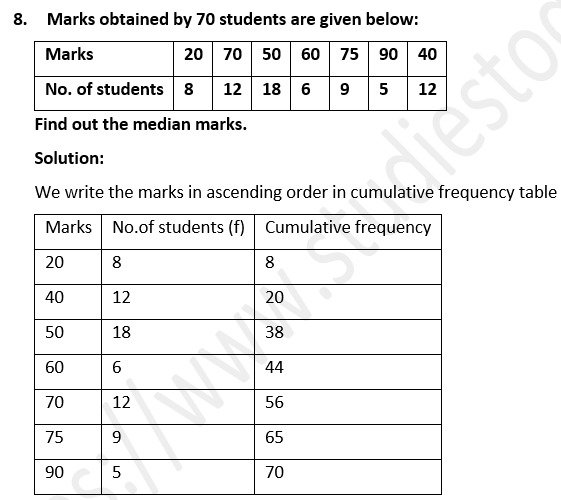
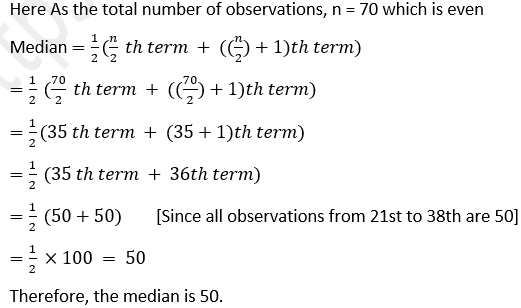
8. Marks obtained by 200 students in an examination are given below
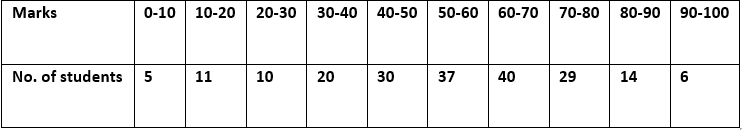
Draw an ogive for the given distribution taking 2 cm = 10 marks on one axis and 2 cm = 20 students on the other axis.
Using the graph, determine
(i) The median marks.
(ii) The number of students who failed if minimum marks required to pass is 40.
(iii) If scoring 85 and more marks is considered as grade one, Find out the number of students who secured grade one in the examination.
Solution:
When We write the given data in cumulative frequency table.
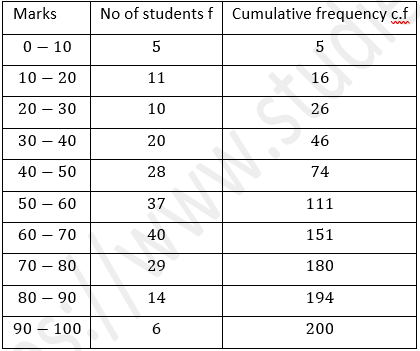
To represent the data in the table graphically, we mark the upper limits of the class intervals on the horizontal axis (x-axis) and their corresponding cumulative frequencies on the vertical axis ( y-axis),
Plot the points (10, 5), (20, 16), (30, 26), (40, 46), (50, 74), (60, 111) , (70, 151) (80, 180) (90, 194) and (100, 200) on the graph. Join the points with the free hand.Therefore We get an ogive as shown:
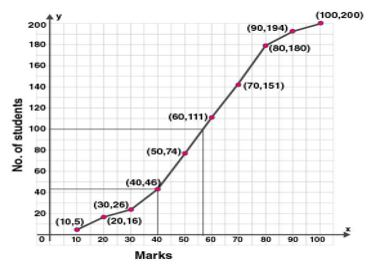
(i) Here n= 200
Median = (n/2)th term
=200/2
= 100th term
= 57 [from graph]
(ii) number of students failed if minimum marks required to pass is 40 = 44 [from graph]
(iii) Number of students who got grade 1 = number of students who scored 85 and more
= 200-188
= 12[From graph]
9. The monthly income of a group of 320 employees in a company is given below

Draw an ogive of the given distribution on a graph sheet taking 2 cm = Rs. 1000 on one axis and 2 cm = 50 employees on the other axis.
From the graph determine
(i) the median wage.
(ii) the number of employees whose income is below Rs. 8500.
(iii) If the salary of a senior employee is above Rs. 11500, Find out the number of senior employees in the company.
(iv) the upper quartile.
Solution:
When We write the given data in cumulative frequency table.
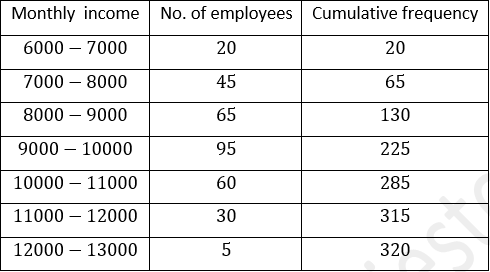
To represent the data in the table graphically, we mark the upper limits of the class intervals on the horizontal axis (x-axis) and their corresponding cumulative frequencies on the vertical axis ( y-axis),
Plot the points (7000, 20), (8000, 65), (9000, 130), (10000, 225), (11000, 285), (12000, 315) and (13000, 320) on the graph.
Join the points with the free hand. Therefore, We get an ogive as shown:
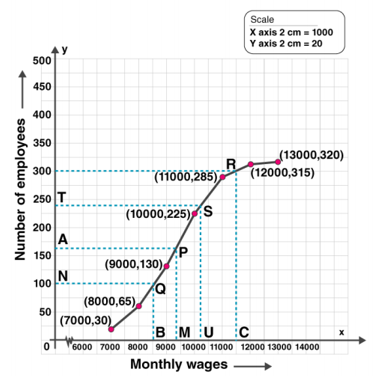
(i) here n = 320
Median = (n/2)th term
=320/2
= 160th term
Mark the point A(160) on Y axis.
Draw a line parallel to x axis from that point.
Let it meet the curve at P.
Draw a perpendicular from P to X axis which meets at M.
M is the median.
Therefore, median is 9300. [from graph]
(ii) Mark the point B(8500) on X axis.
Draw a line parallel to Y axis which meets curve at Q.
From Q draw a line parallel to X axis which meets Y axis at N.
N = 98
Therefore, number of employees whose income is below 8500 = 98
(iii) Mark the point C(11500) on the x-axis.
Draw a line perpendicular to x-axis meeting the curve at R.
From R, draw a line parallel to x-axis meeting y-axis at L which is 300
No. of employees getting more than Rs. 11500 = 320-300 = 20
(iv) upper quartile =3n/4
= 3×320/4
= 240 Mark the point T(240) on Y axis.
From that point on y-axis, draw a line perpendicular on the x-axis which meets the curve at S.
From S, draw a perpendicular on x-axis meeting it at U, which is 10250.
Therefore, upper quartile is 10250.
10. Using a graph paper, draw an ogive for the following distribution which shows a record of the weight in kilograms of 200 students
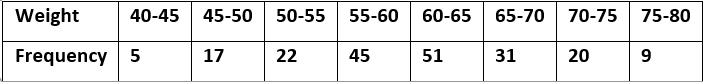
Use your ogive to estimate the following:
(i) The percentage of students weighing 55 kg or more.
(ii) The weight above which the heaviest 30% of the students fall,
(iii) The number of students who are : 1. under-weight and 2. over-weight, if 55.70 kg is considered as standard weight
Solution:
When We write the given data in cumulative frequency table.
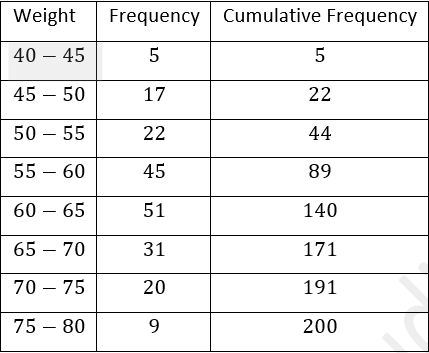
To represent the data in the table graphically, we mark the upper limits of the class intervals on the horizontal axis (x-axis) and their corresponding cumulative frequencies on the vertical axis ( y-axis),
Plot the points (45, 5), (50, 22), (55, 44), (60, 89), (65, 140), (70, 171), (75, 191) and (80, 200) on the graph. Join the points with the free hand. Therefore, We get an ogive as shown:
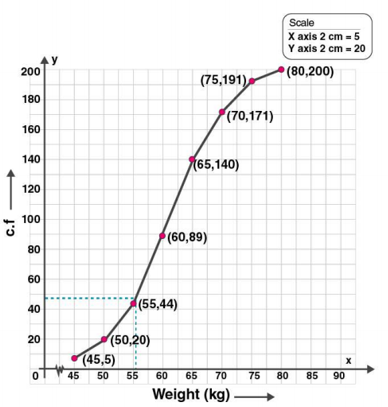
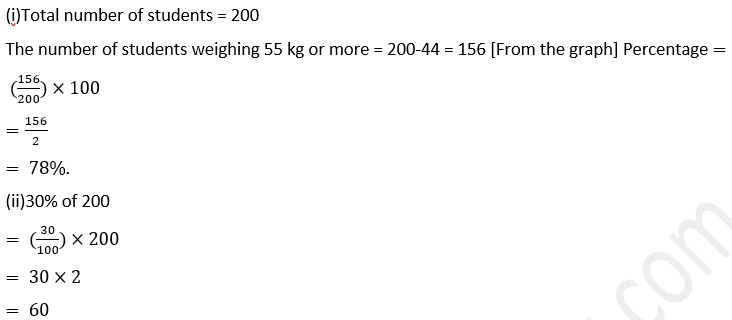
No of heaviest students = 31+20+9 = 60
60 students fall above 65 kg.
(iii)If 55.70 kg is the standard weight,
No. of students who are under weight = 47 [from graph]
Therefore, No. of students who are overweight = 200−47 = 153
11. The marks obtained by 100 students in a Mathematics test are given below
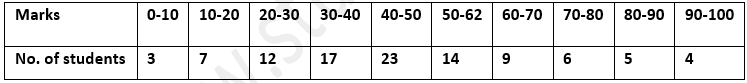
Draw an ogive on a graph sheet and from it determine the :
(i) median
(ii) lower quartile
(iii) number of students who obtained more than 85% marks in the test.
(iv) number of students who did not pass in the test if the pass percentage was 35.
Solution:
When We write the given data in cumulative frequency table
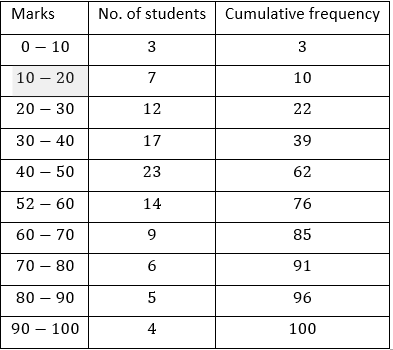
Plot the points (10, 3), (20, 10), (30, 22), (40, 39), (50, 62), (60, 76), (70, 85), (80, 91), (90, 96) and (100, 100) on the graph.
Join the points with the free hand. Therefore, We get an ogive as shown:
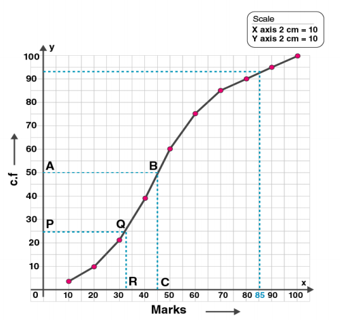
(i)Here n = 100
Median =n/2
= 50 th term
Mark a point A(50) on Y axis.
Draw a line parallel to X axis from A. Let it meet the curve at B. From B draw a perpendicular which meets X axis at C.
The point C is 45.
Therefore, the median is 45.
(ii) Lower quartile =n/4
=100/4
= 25th term
Mark a point P (25) on Y axis.
Draw a line parallel to X axis from that point. Let it meet the curve at Q. From that point draw a perpendicular which meets X axis at R.
The point R is 32.
Therefore, lower quartile is 32.
(iii)no. of students who obtained more than 85% = 100-94 = 6 [from graph]
(iv)No of students who failed if 35% is the pass percentage = 25 [from graph]
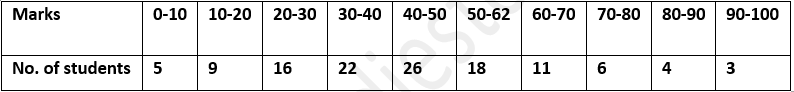
12. The marks obtained by 120 students in a Mathematics test are-given below
Draw an ogive for the given distribution on a graph sheet. Use a suitable scale for ogive to estimate the following:
(i) the median
(ii) the lower quartile
(iii) the number of students who obtained more than 75% marks in the test.
(iv) the number of students who did not pass in the test if the pass percentage was 40.
Solution:
When We write the given data in cumulative frequency table.
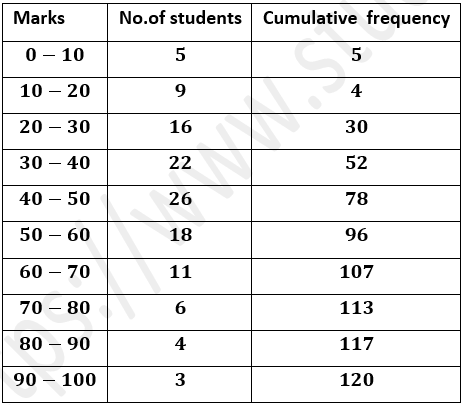
Plot the points (10, 5), (20, 14), (30, 30), (40, 52), (50, 78), (60, 96), (70, 107), (80, 113), (90, 117) and (100, 120) on the graph.
Join the points with the free hand. Therefore,We get an ogive as shown:
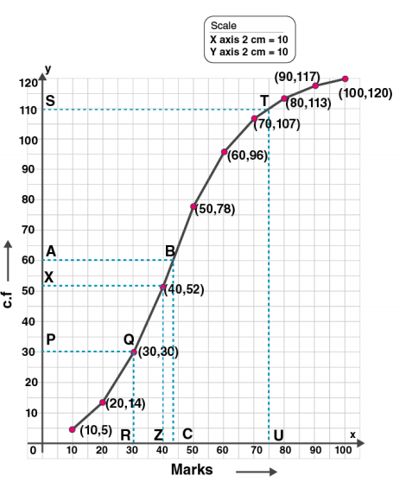
(i)Here n = 120
Median = (n/2)th term
=120/2
= 60th term Mark point A(60) on Y axis. Draw a line parallel to X axis from A.
Let it meet the curve at B. Draw a straight line from B to X axis which meets at C. C = 50
Therefore, median is 50.
(ii)Lower quartile = (n/4) th term
=120/4
= 30th term
Mark a point P (30) on Y axis. Draw a line parallel to X axis from that point.
Let it meet the curve at Q. From that point draw a perpendicular which meets X axis at R. The point R is 30.
Therefore, lower quartile is 30.
(iii)Mark a point U(75) on X axis.
Draw a line parallel to Y axis which meets curve at T.
From T, draw a line parallel to X axis to meet Y axis at S.
S = 110
Therefore, No. of students who obtained more than 75% = 120-110 = 10
(iv) Mark a point Z(40) on X axis.
Draw a line parallel to Y axis which meets curve at Y.
From Y, draw a line parallel to X axis to meet Y axis at X.
X = 52
Therefore the No of students who failed if 40% is the pass percentage is 52.
13. The following distribution represents the height of 160 students of a school.
Height140-145145-150150-155155-160160-165165-170170-175175-180
Draw an ogive for the given distribution taking 2 cm = 5 cm of height on one axis and 2 cm = 20 students on the other axis.
Using the graph, determine :
(i)The median height.
(ii)The inter quartile range.
(iii) The number of students whose height is above 172 cm.
Solution:
When We write the given data in cumulative frequency table.
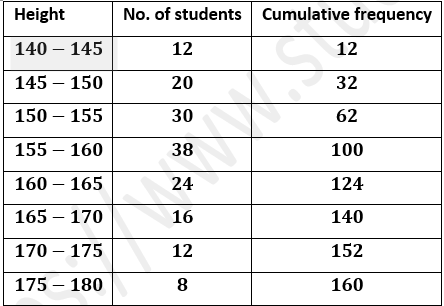
Plot the points (145, 12), (150, 32), (155, 62), (160, 100), (165, 124), (170, 140), (175, 152), and (180, 160) on the graph.
Join the points with the free hand. ThereforeWe get an ogive as shown:
(i)Here n = 160
Median = (n/2)th term
=160/2
= 80th term
Mark point A(80) on Y axis. Draw a line parallel to X axis from A.
Let it meet the curve at B. Draw a straight line from B to X axis which meets at C.
C = 157.5
Therefore, median is 157.5.
(ii) Lower quartile , Q1 = (n/4)th term
=160/4
= 40th term Proceeding in the same way mentioned in (i),
we get lower quartile = 152 [Point R]
Upper quartile, Q3 = 3n/4
= 3×160/4
= 3×40
= 120th term
Proceeding in the same way mentioned in (i),
we get upper quartile = 164 [Point Z]
Interquartile range = Q3-Q1
= 164-152
= 12
(iii)Mark a point O(172 ) on X axis. Draw a line parallel to Y axis from O.
Let it meet the curve at N. Draw a straight line from N to Y axis which meets at M.
M = 144
Therefore, the number of students whose height is more than 172 cm is 160-144 = 16
14. 100 pupils in a school have heights as tabulated below
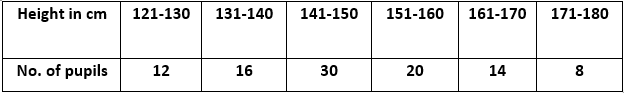
Draw the ogive for the above data and from it determine the median (use graph paper).
Solution:
When We write the given data in cumulative frequency table (in continuous distribution):
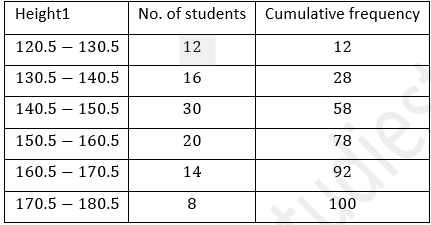
Plot the points (130.5, 12), (140.5, 28), (150.5, 58), (160.5, 78), (170.5, 92) and (180.5, 100) on the graph.
Join the points with the free hand. Therefore,We get an ogive as shown:
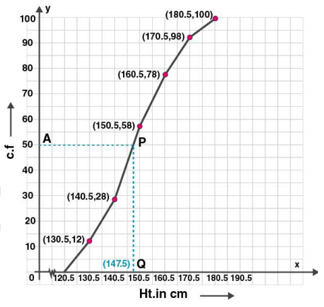
Here n = 100
Median = (n/2)th term
=100/2
= 50th term
Mark point A(50) on Y axis. Draw a line parallel to X axis from A.
Let it meet the curve at P. Draw a straight line from P to X axis which meets at Q.
Q = 147.5
Therefore, median is 147.5.
Chapter Test
1. Arun scored 36 marks in English, 44 marks in Civics, 75 marks in Mathematics and x marks in Science. If he has scored an average of 50 marks, Find out x.
Solution:
As we have given Marks scored in English = 36
As we have given Marks scored in Civics = 44
As we have given Marks scored in Mathematics = 75
Marks scored in Science = x
No. of subjects = 4
Average marks = sum of marks / No.of subjects = 50 [Given]
∴(36+44+75+x)/4 = 50
∴155+x = 4×50
∴155+x = 200
∴x = 200-155
∴x = 45
Therefore, the value of x is 45
2. The mean of 20 numbers is 18. If 3 is added to each of the first ten numbers, Find out the mean of new set of 20 numbers.
Solution:
As we have Given the mean of 20 numbers = 18
∴Sum of numbers = 18×20
= 360
If 3 is added to each of first 10 numbers, then new sum = (3×10)+360
= 30+360
= 390
∴New mean = 390/20
= 19.5
Therefore, the mean of new set of 20 numbers is 19.5.
3. The average height of 30 students is 150 cm. It was detected later that one value of 165 cm was wrongly copied as 135 cm for computation of mean. Find out the correct mean.
Solution:
As we have given the Average height of 30 students = 150 cm
So sum of height = 150×30
= 4500
Difference between correct value and wrong value = 165-135
= 30
So actual sum = 4500+30
= 4530
So actual mean =4530/30
= 31
Therefore, the correct mean 31.
4. There are 50 students in a class of which 40 are boys and the rest girls. The average weight of the students in the class is 44 kg and average weight of the girls is 40 kg. Find out the average weight of boys.
Solution:
As the givenTotal number of students = 50
No. of boys = 40
∴No. of girls = 50-40
= 10
Average weight of 50 students = 44 kg
So sum of weight = 44×50
= 2200 kg
Average weight of girls = 40 kg
So sum of weight of girls = 40×10
= 400 kg
Therefore, Total weight of boys = 2200-400
= 1800 kg
∴Average weight of boys =1800/40
= 45 kg
Therefore, the average weight of boys is 45 kg.
5. The contents of 50 boxes of matches were counted giving the following results.
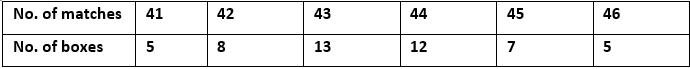
Find out the mean number of matches per box.
Solution:
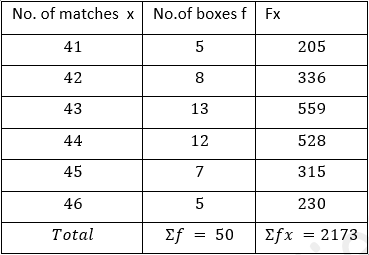
Mean = Ʃfx/Ʃf
=2173/50
= 43.46
Therefore, the mean is 43.46.
6. The heights of 50 children were measured (correct to the nearest cm) giving the following results
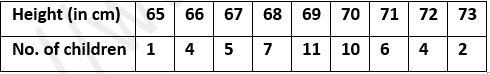
Find out the mean height for this distribution correct to one place of decimal.
Solution:
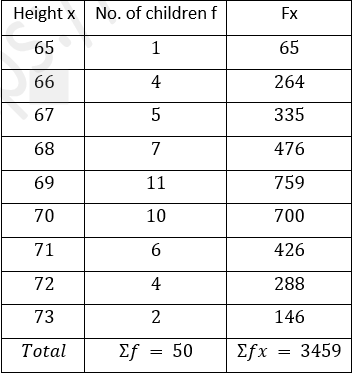
Mean =Ʃfx/Ʃf
=3459/50
= 69.18
= 69.2 [corrected to one decimal place]
Therefore, the mean is 69.2.
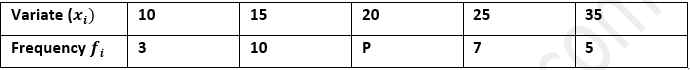
7. Find out the value of p for the following distribution whose mean is 20.6.
Solution:-
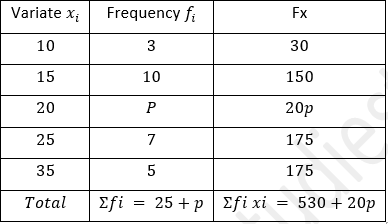
Mean =Ʃfx/Ʃf
∴20.6 =(530+20p )/(25+p) [Given mean = 20.6]
∴20.6(25+p)
= (530+20p)
Therefore 515 + 20.6p = 530+20p
20.6p-20p = 530-515
0.6p = 15
p =15/0.6
p = 25
Therefore, the value of p is 25.
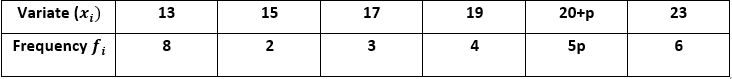
8. Find out the value of p if the mean of the following distribution is 18.
Solution:-
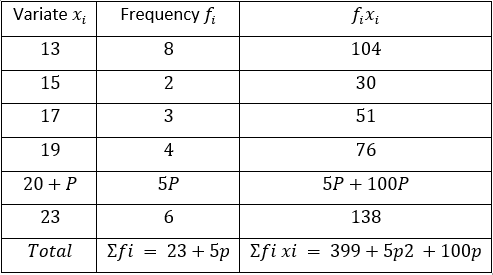
Mean = Ʃfixi/Ʃfi
∴18 =(399+5p2 +100p)/( 23+5p) [Given mean = 18]
∴18(23+5p) = 399+5p2 +100p
∴414 + 90p = 399+5p2 +100p
∴5p2 +100p-90p+399-414 = 0
∴5p2 +10p-15 = 0
Dividing by 5, we get
∴p2 +2p-3 = 0
∴(p-1)(p+3) = 0
∴p-1 = 0 or p+3 = 0
p = 1 or p = -3
Therefore, p cannot be negative.
So p = 1
Therefore, the value of p is 1.
9. Find out the mean age in years from the frequency distribution given below:
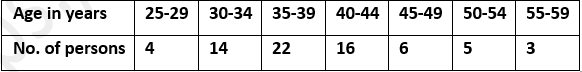
Solution:
As we have The given distribution is not continuous.
Adjustment factor =(30-29)/2
=1/2
= 0.5
We subtract 0.5 from lower limit of the class interval and add 0.5 to upper limit.
So the new table in continuous form is given below.
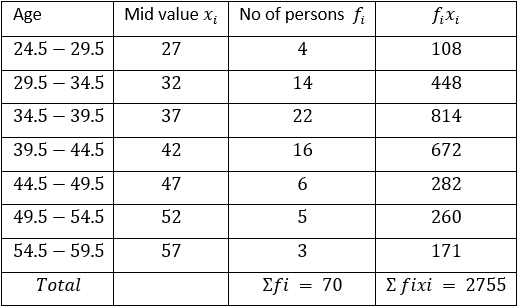
Mean =Ʃfixi/Ʃfi
=2755/70
= 39.357
= 39.36
Therefore, the mean age is 39.36 years.
10. Find out the Arithmetic mean, correct to one decimal place, for the following frequency
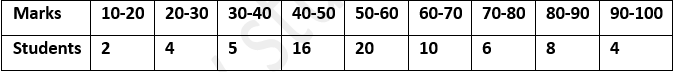
Solution:
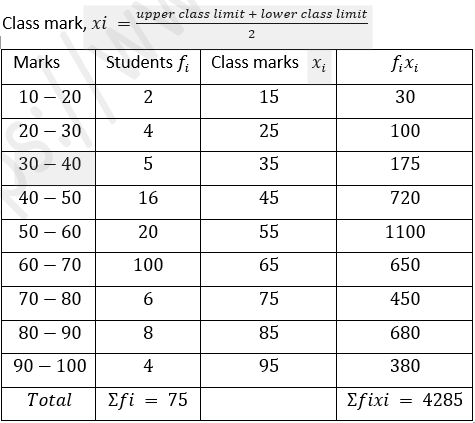
Mean =Ʃfixi/Ʃfi
=4285/75
= 57.133
= 57.1
Therefore, the mean is 57.1.
11. The mean of the following frequency distribution is 62.8. Find out the value of p.
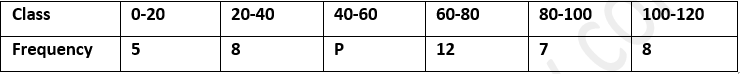
Solution:-
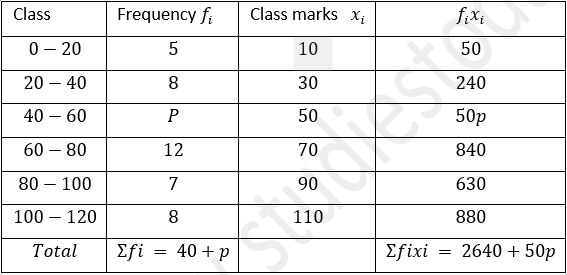
Mean = Ʃfixi/Ʃfi
62.8 =(2640+50p)/( 40+p) [Given mean = 62.8]
62.8(40+p) = 2640+50p
2512+62.8p = 2640+50p
62.8p-50p = 2640-2512
12.8p = 128
p =128/12.8
∴p = 10
Therefore, the value of p is 10.
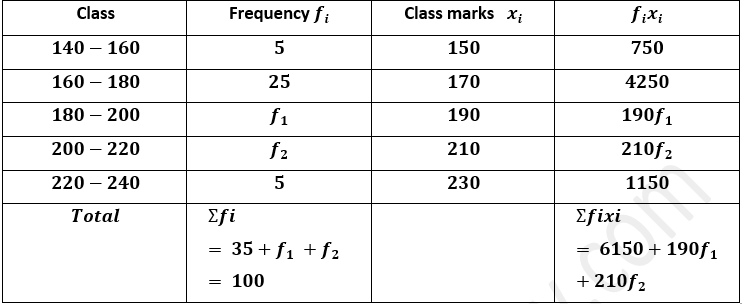
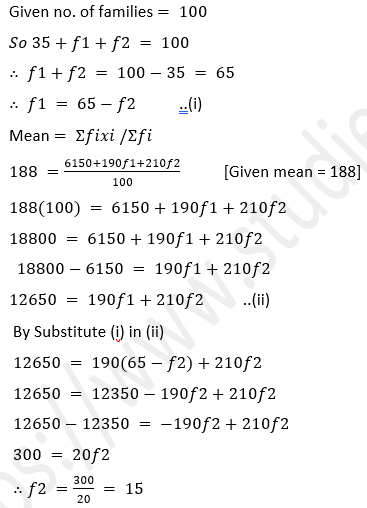
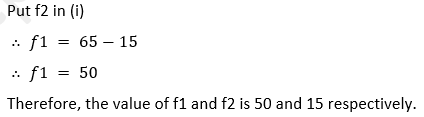
12. The daily expenditure of 100 families are given below. Find out f1, and f2, if the mean daily expenditure is Rs 188.

Solution:
As we have the Given mean = 188
13. The measures of the diameter of the heads of 150 screw is given in the following table. If the mean diameter of the heads of the screws is 51.2 mm, Find out the values of p and q .
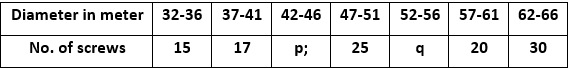
Solution:
As we have the Given mean = 51.2 mm
The given distribution is not continuous.
Adjustment factor =(37-36)/2 =1/2 = 0.5
We subtract 0.5 from lower limit of the class interval and add 0.5 to upper limit.
Therefore the new table in continuous form is given below.
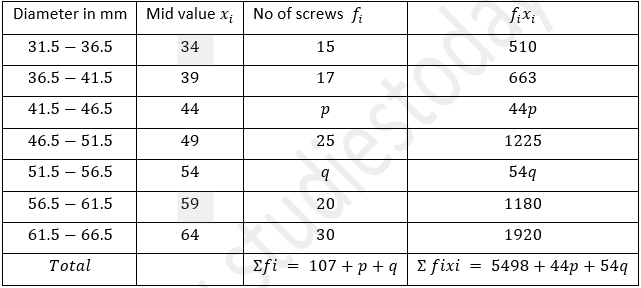
Given No. of screws = 150
∴107+p+q = 150
p = 150-107-q
p = 43-q ..(i)
Mean =Ʃfxi/Ʃfi
∴51.2 =(5498+44p+54q)/150
51.2×150 = 5498+44p+54q
7680 = 5498+44(43-q)+54q
7680 = 5498+1892-44q+54q
7680 -5498-1892 = -44q+54q
290 = 10q
∴q = 290/10
= 29 Put q in (i)
p = 43-29
∴p = 14
Therefore, the value of p and q is 14 and 29 respectively.
15. If the median of 5, 9, 11, 3, 4, x, 8 is 6, Find out the value of x.
Solution:
When we Arranging the given numbers in ascending order
3,4,5,x,8,9,11
Here n = 7 which is odd
Given median = 6
So Median =((n+1)/2) th term
∴6 = ((7+1)/2)th term
∴6 = ((8/2)th term
∴6 = 4th term
∴6 = x
Therefore, the value of x is 6
16. Find out the median of: 17, 26, 60, 45, 33, 32, 29, 34, 56 . If 26 is replaced by 62, Find out the new median.
Solution:
Arranging numbers in ascending order
17,26,29,32,33,34,45,56,60
Here n = 9 which is odd.
So Median =( (n+1)/2) th term
∴Median = ((9+1)/2)th term
∴Median = (10/2)th term
∴Median = 5th term
∴Median = 33
Hence median is 33..
When 26 is replaced by 62, new set of numbers in ascending order is shown below. 17,29,32,33,34,45,56,60,62
Here n = 9 which is odd.
So Median =((n+1)/2) th term
∴Median = ((9+1)/2)th term
∴Median = (10/2)th term
∴Median = 5th term
∴Median = 34
Therefore, median is 34.
17. The marks scored by 16 students in a class test are : 3, 6, 8, 13, 15, 5, 21, 23, 17, 10, 9, 1, 20, 21, 18, 12 Find out
(i) the median
(ii) lower quartile
(iii) upper quartile
Solution:
When we Arranging the given data in ascending order
1,3,5,6,8,9,10,12,13,15,17,18,20,21,21,23
Here n = 16 which is even
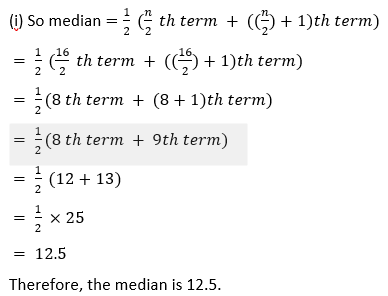
(ii) Lower quartile,Q1 = (n/4)th term
=16/4
= 4 th term
= 6
Therefore, the lower quartile is 6.
(iii)Upper quartile, Q3 = (3n/4)th term
= (3×16/4)th term
= (3×4) th term
= 12 th term
= 18
Therefore, the upper quartile is 18.
18. Find out the median and mode for the set of numbers: 2, 2, 3, 5, 5, 5, 6, 8, 9
Solution:
Here n = 9 which is odd.
∴Median = ((n+1)/2)th term
∴Median = ((9+1)/2)th term
∴Median = (10/2 )th term
∴Median = 5 th term
Therefore, Median = 5
Mode is the number which appears most often in a set of numbers.
Here 5 occurs maximum number of times.
Therefore mode is 5.
19. Find out the mean, the median and the mode of the following distribution.

Solution:
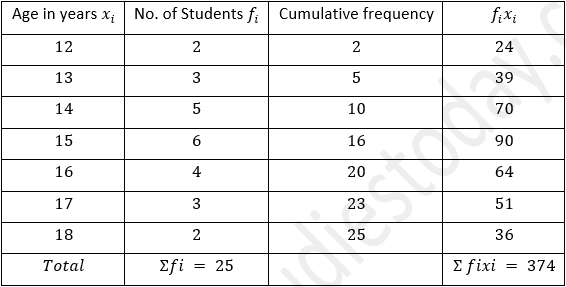
Mean =Ʃfixi/Ʃfi
=374/25
= 14.96
Therefore the mean is 14.96.
Here
n = 25 which is odd.
∴Median = ((n+1)/2)th term
∴Median = ((25+1)/2)th term
∴Median = (26/2)th term
∴Median = 13 th term
∴Median = 15
Therefore, the median is 15.
Here 15 occurs maximum number of times. i.e., 6 times.
Therefore, the mode is 15.
20. The daily wages of 30 employees in an establishment are distributed as follows:
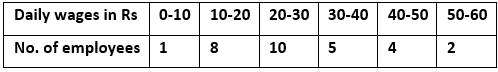
Estimate the modal daily wages for this distribution by a graphical method.
Solution:
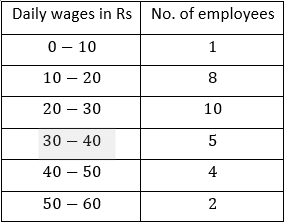
Estimate the modal daily wages for this distribution by a graphical method.
Solution:
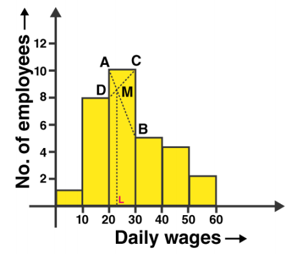
Join AB and CD intersecting each other at M. From M draw ML perpendicular to x-axis.
L is the mode
Therefore Mode = Rs 23
Therefore, the mode is Rs. 23.
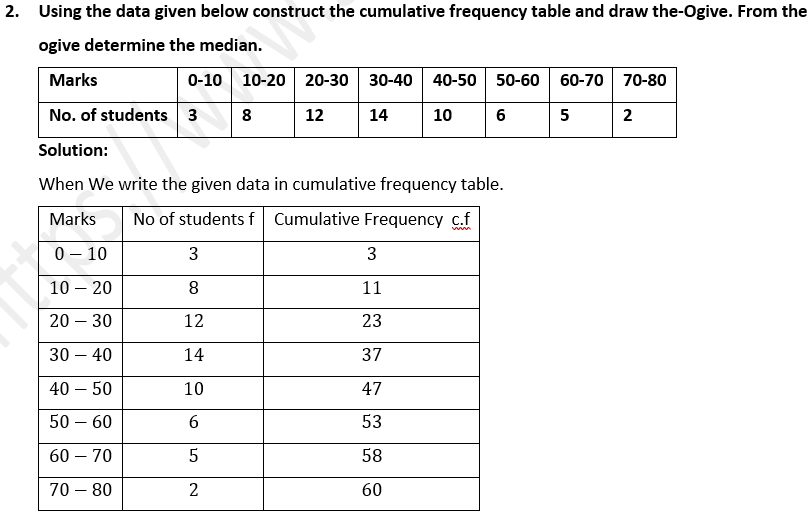
21. Using the data given below, construct the cumulative frequency table and draw the ogive. From the ogive, estimate :
(i) the median
(ii) the inter quartile range.
Also state the median class
Solution:
To represent the data in the table graphically, we mark the upper limits of the class intervals on the horizontal axis (x-axis) and their corresponding cumulative frequencies on the vertical axis ( y-axis).
Plot the points (10, 3), (20, 11), (30, 23), (40, 37), (50, 47), (60, 53), (70, 58) and (80, 60) on the graph. Join the points with the free hand. Therefore We get an ogive as shown:
(i)Here number of observations, n = 60 which is even.
So median = (n/2) th term
= (60/2) th term
= 30 th term
Mark a point A(30) on Y-axis. From A, draw a horizontal line parallel to X-axis meeting the curve at P. From P draw a line perpendicular to the x-axis which meets it at Q.
∴Q is the median .
Q = 35
Therefore, the median is 35 .
(ii) Lower quartile,
Q1 =n/4
=60/4
= 15th term
Upper quartile, Q3 =3n/4
= 3×60/4
= 45th term
Mark a point B(15) and C(45) on Y-axis. From B and C, draw a horizontal line parallel to X-axis meeting the curve at L and M respectively. From L and M, draw lines perpendicular to the x-axis which meets it at E and F
respectively.
E is the lower quartile .
E = 22.3
F is the upper quartile.
F = 47
Inter quartile range = Q3-Q1
= 47-22.3
= 24.7
Therefore , interquartile range is 24.7.
22. Draw a cumulative frequency curve for the following data :
(i) the median
(ii) the pass marks if 85% of the students pass.
(iii) the marks which 45% of the students exceed.
Solution:-

To represent the data in the table graphically, we mark the upper limits of the class intervals on the horizontal axis (x-axis) and their corresponding cumulative frequencies on the vertical axis ( y-axis).
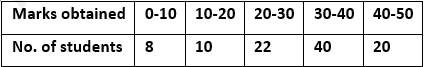
Plot the points (10, 8), (20, 18), (30, 40), (40, 80), and(50,100) on the graph. Join the points with the free hand. Therefore We get an ogive as shown:
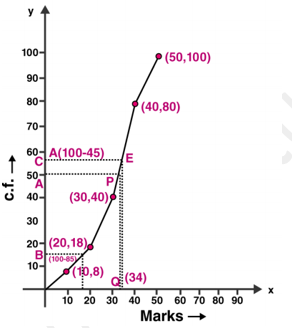
(i) Here number of observations, n = 100 which is even.
So median = (n/2) th term
= (100/2)th term
= 50 th term
Mark a point A(50) on Y-axis. From A, draw a horizontal line parallel to X-axis meeting the curve at P. From P, draw a line perpendicular to the x-axis which meets it at Q.
∴Q is the median .
Q = 32.5
Therefore, the median is 32.5 .
(ii)Total number of students = 100
85% of 100
= 85
Remaining number of students = 100-85
= 15
Mark a point B(15) on Y axis. From B, draw a horizontal line parallel to X-axis meeting the curve at L. From L, draw a line perpendicular to the x-axis which meets it at M.
Therefore, M = 18
The pass marks will be 18 if 85% of students passed.
(iii) Total number of students = 100
45% of 100
= 45 Remaining number of students = 100-45 = 55
Mark a point C(55) on Y axis. From C, draw a horizontal line parallel to X-axis meeting the curve at E. From E,
draw a line perpendicular to the x-axis which meets it at F.
Here F = 34
Hence marks which 45% of students exceeds is 34 marks