
Read and download the CBSE Class 8 Mathematics Introduction to Graphs Assignment Set 02 for the 2026-27 academic session. We have provided comprehensive Class 8 Mathematics school assignments that have important solved questions and answers for Chapter 15 Introduction To Graphs. These resources have been carefuly prepared by expert teachers as per the latest NCERT, CBSE, and KVS syllabus guidelines.
Solved Assignment for Class 8 Mathematics Chapter 15 Introduction To Graphs
Practicing these Class 8 Mathematics problems daily is must to improve your conceptual understanding and score better marks in school examinations. These printable assignments are a perfect assessment tool for Chapter 15 Introduction To Graphs, covering both basic and advanced level questions to help you get more marks in exams.
Chapter 15 Introduction To Graphs Class 8 Solved Questions and Answers
1. (0, – 3) lies on ________.
(A) Positive x-axis
(B) Negative x-axis
(C) Positive y-axis
(D) Negative y-axis
Answer : D
2. To draw the graph of a line, the least number of points required is ________.
(A) One
(B) Two
(C) Three
(D) Four
Answer : B
DIRECTION (3-4) : The following graph shows the temperature of a patient admitted in a hospital, recorded every 2 hours.

3. What was the patient’s temperature at 3 p.m.?
(A) 37.5 °C
(B) 38 °C
(C) 36 °C
(D) 37 °C
Answer : A
4. When was the patient’s temperature highest ?
(A) 10 a.m.
(B) 6 p.m.
(C) 4 p.m.
(D) 2 p.m.
Answer : B
5. Which of the following graphs cannot be a time temperature graph?
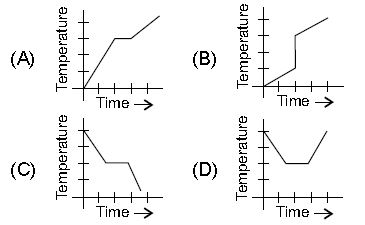
Answer : B
DIRECTION (6-7) : The line graph shows the performance of two students during a year. Read the graph and answer the following questions.

6. In which test student B showed his worst performance?
(A) Test 5
(B) Test 3
(C) Test 2
(D) Test 1
Answer : D
7. In all, whose performance is better during the year?
(A) Student A
(B) Both showed same performance
(C) Student B
(D) Can’t be determined
Answer : C
8. The point of intersection of co-ordinate axes is called _______.
(A) Common point
(B) Zero point
(C) Origin
(D) Null point
Answer : C
DIRECTION (9-10) : Observe the given graph and answer the following questions.
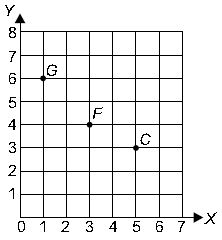
9. The coordinate of F is
(A) (4, 3)
(B) (3, 4)
(C) (3, 3)
(D) (4, 4)
Answer : B
10. The difference between y-coordinate of G and C is
(A) 3
(B) 2
(C) 4
(D) 1
Answer : A
DIRECTION (11-12): The graph shown below exhibits the rate of interest on fixed deposits upto one year announced by the Reserve Bank of India in different years. Read the graph and answer the following questions.
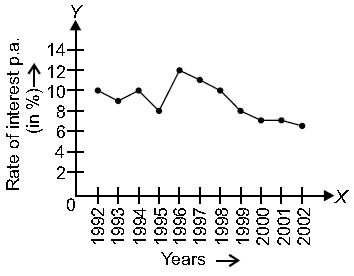
11. The difference between maximum and minimum rate of interest is _______.
(A) 3%
(B) 6%
(C) 4%
(D) 5%
Answer : D
12. The sum of rate of interest in 1993 and 1998 is _______.
(A) 12.5%
(B) 13%
(C) 10%
(D) 19%
Answer : D
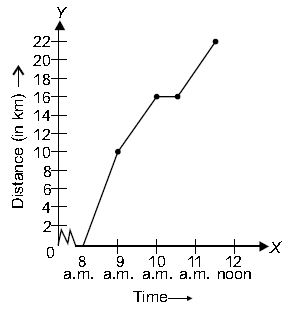
DIRECTION (13-15) : A courier person cycles from a town to a neighbouring sub-urban area to deliver a parcel to a merchant. His distance from the town at different times is shown by the following graph.
13. How much time did the person take to reach the place of merchant?
(A) 3.5 hours
(B) 2 hours
(C) 1.5 hours
(D) 3 hours
Answer : A
14. How far is the place of merchant from the town?
(A) 19 km
(B) 18 km
(C) 22 km
(D) 20 km
Answer : C
15. During which period did he ride fastest ?
(A) 9 a.m. - 10 a.m.
(B) 10 a.m. - 11 a.m.
(C) 8 a.m. - 9 a.m.
(D) 11 a.m. - 11:30 a.m.
Answer : C
16. The graph shows the temperature forecast and the actual temperature of a city on ten days.
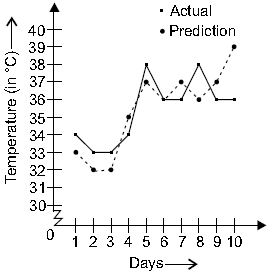
On what day, the graph shows the maximum deviation of actual temperature from the forecast?
(A) Day 10
(B) Day 8
(C) Day 5
(D) Day 4
Answer : A
17. The graph shows the production of cycles (in thousands) of two factories A and B for ten years.
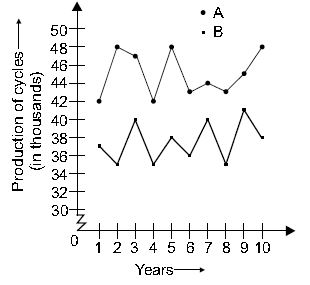
Find the production of cycles of A in the year when combined production of cycles was maximum.
(A) 47 thousands
(B) 48 thousands
(C) 49 thousands
(D) 46 thousands
Answer : A
18. The following graph shows the number of books read by Ashok in a week.
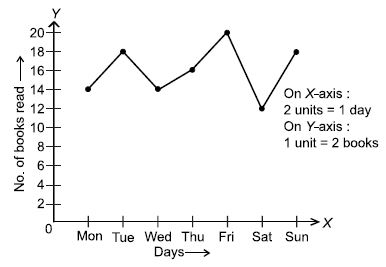
Find the ratio of number of books read on Tuesday and Wednesday together to the total number of books read.
(A) 2 : 7
(B) 3 : 7
(C) 1 : 7
(D) 6 : 7
Answer : A
19. The following graph shows the amount of milk (in litres) that a milkman sold over 10 days.
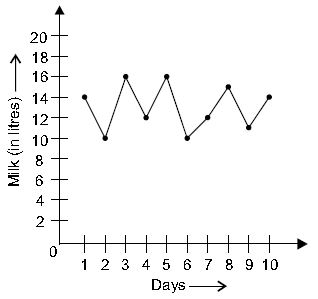
On an average, how much milk he sells every day ?
(A) 10 litres
(B) 12.5 litres
(C) 11 litres
(D) 13 litres
Answer : D
20. Study the graph and answer the questions that follow.
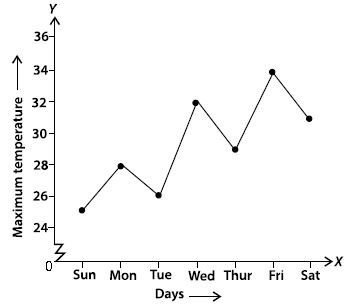
(a) On which day was the temperature 31°C?
(b) On which day was the temperature the least?
(c) Which was the hottest day?
(a) (b) (c)
(A) Saturday Sunday Friday
(B) Sunday Monday Tuesday
(C) Monday Sunday Friday
(D) Wednesday Saturday Wednesday
Answer : A


Click on link below to download CBSE Class 8 Mathematics Introduction to Graphs Assignment Set B
Free study material for Mathematics
CBSE Class 8 Mathematics Chapter 15 Introduction To Graphs Assignment
Access the latest Chapter 15 Introduction To Graphs assignments designed as per the current CBSE syllabus for Class 8. We have included all question types, including MCQs, short answer questions, and long-form problems relating to Chapter 15 Introduction To Graphs. You can easily download these assignments in PDF format for free. Our expert teachers have carefully looked at previous year exam patterns and have made sure that these questions help you prepare properly for your upcoming school tests.
Benefits of solving Assignments for Chapter 15 Introduction To Graphs
Practicing these Class 8 Mathematics assignments has many advantages for you:
- Better Exam Scores: Regular practice will help you to understand Chapter 15 Introduction To Graphs properly and you will be able to answer exam questions correctly.
- Latest Exam Pattern: All questions are aligned as per the latest CBSE sample papers and marking schemes.
- Huge Variety of Questions: These Chapter 15 Introduction To Graphs sets include Case Studies, objective questions, and various descriptive problems with answers.
- Time Management: Solving these Chapter 15 Introduction To Graphs test papers daily will improve your speed and accuracy.
How to solve Mathematics Chapter 15 Introduction To Graphs Assignments effectively?
- Read the Chapter First: Start with the NCERT book for Class 8 Mathematics before attempting the assignment.
- Self-Assessment: Try solving the Chapter 15 Introduction To Graphs questions by yourself and then check the solutions provided by us.
- Use Supporting Material: Refer to our Revision Notes and Class 8 worksheets if you get stuck on any topic.
- Track Mistakes: Maintain a notebook for tricky concepts and revise them using our online MCQ tests.
Best Practices for Class 8 Mathematics Preparation
For the best results, solve one assignment for Chapter 15 Introduction To Graphs on daily basis. Using a timer while practicing will further improve your problem-solving skills and prepare you for the actual CBSE exam.
FAQs
You can download free PDF assignments for Class 8 Mathematics Chapter 15 Introduction To Graphs from StudiesToday.com. These practice sheets have been updated for the 2026-27 session covering all concepts from latest NCERT textbook.
Yes, our teachers have given solutions for all questions in the Class 8 Mathematics Chapter 15 Introduction To Graphs assignments. This will help you to understand step-by-step methodology to get full marks in school tests and exams.
Yes. These assignments are designed as per the latest CBSE syllabus for 2026. We have included huge variety of question formats such as MCQs, Case-study based questions and important diagram-based problems found in Chapter 15 Introduction To Graphs.
Practicing topicw wise assignments will help Class 8 students understand every sub-topic of Chapter 15 Introduction To Graphs. Daily practice will improve speed, accuracy and answering competency-based questions.
Yes, all printable assignments for Class 8 Mathematics Chapter 15 Introduction To Graphs are available for free download in mobile-friendly PDF format.