

Download CBSE Class 11 Economics Useful Resources
Review targeted academic resources with the CBSE Class 11 Economics Measures of Dispersion Set 02. Built according to official CBSE standards for the 2026-27 term, these downloadable Class 11 Economics study materials support effective daily practice and deeper conceptual understanding for Chapter 06 Measures of Dispersion.
Access CBSE Study Guides and Summaries
Navigate directly to the advanced Economics study materials using the digital viewer below. Each resource pack includes detailed conceptual summaries and solved practice questions, allowing students to instantly reinforce their learning.
CBSE Class 11 Economics - Measures of Dispersion (2). There are many more useful educational material which the students can download in pdf format and use them for studies. Study material like concept maps, important and sure shot question banks, quick to learn flash cards, flow charts, mind maps, teacher notes, important formulas, past examinations question bank, important concepts taught by teachers. Students can download these useful educational material free and use them to get better marks in examinations. Also refer to other worksheets for the same chapter and other subjects too. Use them for better understanding of the subjects.
MEASURES OF DISPERSION RANGE AND QUARTILE DEVIATION
Very short answer questions (1 mark each)
1. Define deviation [1 Mark]
Answer:
Deviation is the numerical difference between an individual value or observation and a fixed average, such as the mean, median, or mode.
Teacher's Note:
a) It measures how much data points spread away from a central value.
b) Always keep track of whether the deviation is positive or negative.
2. What does Range mean? [1 Mark]
Answer:
Range is the difference between the largest and smallest values in a given distribution.
Teacher's Note:
a) It is the simplest measure of dispersion.
b) Formula is Range = L - S.
3. State formula of coefficient of Range. [1 Mark]
Answer:
Coefficient of Range = \(\frac{L - S}{L + S}\) where L is the largest value and S is the smallest value.
Teacher's Note:
a) It is a relative measure of dispersion.
b) It is independent of the unit of measurement.
4. Define quartile deviation. [1 Mark]
Answer:
Quartile deviation is half of the difference between the upper quartile (Q3) and the lower quartile (Q1).
Teacher's Note:
a) Formula is \(\frac{Q_3 - Q_1}{2}\).
b) It is also known as semi-interquartile range.
5. What is inter quartile range? [1 Mark]
Answer:
Interquartile range is the difference between the upper quartile and the lower quartile, expressed as \(Q_3 - Q_1\).
Teacher's Note:
a) It covers the middle 50 percent of the data.
b) It eliminates extreme values at both tails.
6. What is the other name for semi interquartile range? [1 Mark]
Answer:
Quartile deviation.
Teacher's Note:
a) Both terms refer to half of the interquartile range.
b) Useful for skewed distributions.
7. State the formula of coefficient of quartile deviation. [1 Mark]
Answer:
Coefficient of Quartile Deviation = \(\frac{Q_3 - Q_1}{Q_3 + Q_1}\)
Teacher's Note:
a) It measures relative dispersion based on quartiles.
b) It is a pure number free from units.
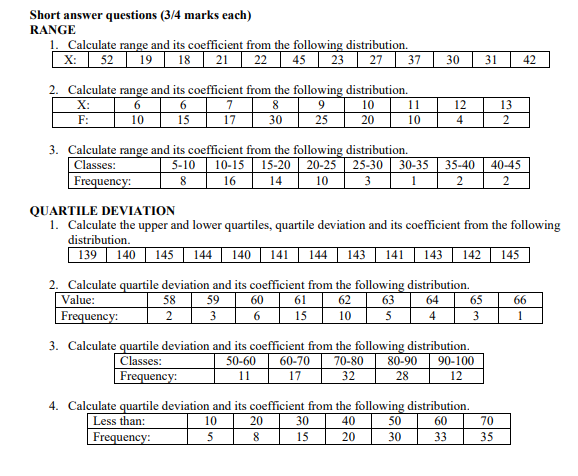
Short answer questions (3/4 marks each)
RANGE
1. Calculate range and its coefficient from the following distribution.
X: 52 19 18 21 22 45 23 27 37 30 31 42 [3 Marks]
Answer:
1. Largest value (L) = 52
2. Smallest value (S) = 18
3. Range = L - S = 52 - 18 = 34
4. Coefficient of Range = \(\frac{L - S}{L + S}\) = \(\frac{52 - 18}{52 + 18}\) = \(\frac{34}{70}\) = 0.4857
Teacher's Note:
a) Identify extreme values carefully from raw data.
b) Range formula depends only on two extreme values.
c) Final coefficient is rounded to four decimal places.
2. Calculate range and its coefficient from the following distribution.
X: 6 6 7 8 9 10 11 12 13
F: 10 15 17 30 25 20 10 4 2 [3 Marks]
Answer:
1. Largest value (L) = 13 (frequencies are ignored in finding range)
2. Smallest value (S) = 6
3. Range = L - S = 13 - 6 = 7
4. Coefficient of Range = \(\frac{L - S}{L + S}\) = \(\frac{13 - 6}{13 + 6}\) = \(\frac{7}{19}\) = 0.3684
Teacher's Note:
a) Frequency values are not used when calculating range.
b) Only the extreme variable values matter.
c) Ensure correct addition in the denominator.
3. Calculate range and its coefficient from the following distribution.
| Classes | 5-10 | 10-15 | 15-20 | 20-25 | 25-30 | 30-35 | 35-40 | 40-45 |
|---|---|---|---|---|---|---|---|---|
| Frequency | 8 | 16 | 14 | 10 | 3 | 1 | 2 | 2 |
[3 Marks]
Answer:
1. Lower limit of the lowest class (S) = 5
2. Upper limit of the highest class (L) = 45
3. Range = L - S = 45 - 5 = 40
4. Coefficient of Range = \(\frac{L - S}{L + S}\) = \(\frac{45 - 5}{45 + 5}\) = \(\frac{40}{50}\) = 0.8
Teacher's Note:
a) For continuous series, use extreme class boundaries.
b) Frequencies play no role in range computation.
c) Division results in a clean decimal value.
QUARTILE DEVIATION
1. Calculate the upper and lower quartiles, quartile deviation and its coefficient from the following distribution.
139 140 145 144 140 141 144 143 141 143 142 145 [4 Marks]
Answer:
1. Arrange data in ascending order: 139, 140, 140, 141, 141, 142, 143, 143, 144, 144, 145, 145 (Total N = 12)
2. Lower quartile Q1 = size of \(\frac{N + 1}{4}\) th item = size of \(\frac{13}{4}\) th = 3.25th item = 140 + 0.25(140 - 140) = 140 (or standard convention: position 3 = 140)
3. Upper quartile Q3 = size of \(\frac{3(N + 1)}{4}\) th item = size of 9.75th item = 144
4. Quartile Deviation = \(\frac{Q_3 - Q_1}{2}\) = \(\frac{144 - 140}{2}\) = 2
5. Coefficient of Quartile Deviation = \(\frac{Q_3 - Q_1}{Q_3 + Q_1}\) = \(\frac{144 - 140}{144 + 140}\) = \(\frac{4}{284}\) = 0.0141
Teacher's Note:
a) Sorting raw data accurately is the primary step.
b) Use standard positional formulas for individual series.
c) Check integer positions if fractional interpolation is skipped.
d) Final coefficient represents relative spread around median.
2. Calculate quartile deviation and its coefficient from the following distribution.
| Value | 58 | 59 | 60 | 61 | 62 | 63 | 64 | 65 | 66 |
|---|---|---|---|---|---|---|---|---|---|
| Frequency | 2 | 3 | 6 | 15 | 10 | 5 | 4 | 3 | 1 |
[4 Marks]
Answer:
1. Cumulative frequencies (cf): 2, 5, 11, 26, 36, 41, 45, 48, 49. Total N = 49.
2. Q1 = size of \(\frac{N + 1}{4}\) th item = \(\frac{50}{4}\) th = 12.5th item, which lies in cf 26 corresponding to value 61.
3. Q3 = size of \(\frac{3(N + 1)}{4}\) th item = 37.5th item, which lies in cf 41 corresponding to value 63.
4. Quartile Deviation = \(\frac{63 - 61}{2}\) = \(\frac{2}{2}\) = 1
5. Coefficient of Quartile Deviation = \(\frac{63 - 61}{63 + 61}\) = \(\frac{2}{124}\) = 0.0161
Teacher's Note:
a) Construct cumulative frequency table correctly.
b) Match position values carefully with cumulative totals.
c) Watch out for discrete series indexing rules.
d) Final calculation yields a compact deviation measure.
3. Calculate quartile deviation and its coefficient from the following distribution.
| Classes | 50-60 | 60-70 | 70-80 | 80-90 | 90-100 |
|---|---|---|---|---|---|
| Frequency | 11 | 17 | 32 | 28 | 12 |
[4 Marks]
Answer:
1. Cumulative frequencies (cf): 11, 28, 60, 88, 100. Total N = 100.
2. Q1 position = \(\frac{N}{4}\) = \(\frac{100}{4}\) = 25th item, which lies in class 60-70.
3. Q1 = \(L + \frac{\frac{N}{4} - cf}{f} \times h\) = \(60 + \frac{25 - 11}{17} \times 10\) = \(60 + \frac{140}{17}\) = 68.24
4. Q3 position = \(\frac{3N}{4}\) = 75th item, which lies in class 80-90.
5. Q3 = \(L + \frac{\frac{3N}{4} - cf}{f} \times h\) = \(80 + \frac{75 - 60}{28} \times 10\) = \(80 + \frac{150}{28}\) = 85.36
6. Quartile Deviation = \(\frac{85.36 - 68.24}{2}\) = \(\frac{17.12}{2}\) = 8.56
7. Coefficient of Quartile Deviation = \(\frac{85.36 - 68.24}{85.36 + 68.24}\) = \(\frac{17.12}{153.60}\) = 0.1115
Teacher's Note:
a) Use continuous series interpolation formula for Q1 and Q3.
b) cf is taken from the preceding class interval.
c) Check interval width h carefully.
d) Verify both quartile computations before finding half-difference.
4. Calculate quartile deviation and its coefficient from the following distribution.
| Less than: | 10 | 20 | 30 | 40 | 50 | 60 | 70 |
|---|---|---|---|---|---|---|---|
| Frequency | 5 | 8 | 15 | 20 | 30 | 33 | 35 |
[4 Marks]
Answer:
1. Convert 'less than' cumulative frequencies into normal class intervals and frequencies:
0-10: 5
10-20: 8 - 5 = 3
20-30: 15 - 8 = 7
30-40: 20 - 15 = 5
40-50: 30 - 20 = 10
50-60: 33 - 30 = 3
60-70: 35 - 33 = 2
2. Total N = 35. Q1 position = \(\frac{35}{4}\) = 8.75th item, lying in 20-30 class.
3. Q1 = \(20 + \frac{8.75 - 5}{7} \times 10\) = \(20 + \frac{3.75 \times 10}{7}\) = 25.36
4. Q3 position = \(\frac{3 \times 35}{4}\) = 26.25th item, lying in 40-50 class.
5. Q3 = \(40 + \frac{26.25 - 20}{10} \times 10\) = \(40 + 6.25\) = 46.25
6. Quartile Deviation = \(\frac{46.25 - 25.36}{2}\) = \(\frac{20.89}{2}\) = 10.45
7. Coefficient of Quartile Deviation = \(\frac{46.25 - 25.36}{46.25 + 25.36}\) = \(\frac{20.89}{71.61}\) = 0.2917
Teacher's Note:
a) Convert cumulative frequency series into simple frequency distribution first.
b) Pay close attention to subtraction of cumulative values.
c) Apply class interpolation formulas precisely.
d) Double-check all intermediate decimal calculations.
Free study material for Economics
Economics Class 11 Exam Resources: Chapter 06 Measures of Dispersion
Quick Revision Material for Chapter 06 Measures of Dispersion
Explore essential learning tools for Class 11 Economics Chapter 06 Measures of Dispersion. This curated collection features in-depth notes and targeted practice questions built around the active 2026 curriculum to streamline your daily revision.
Expert Notes and Solved Exam Questions
Designed around the official curriculum, these study guides guarantee standard compliance. Reviewing step-by-step solutions clarifies complex sub-topics within Chapter 06 Measures of Dispersion and demystifies standard marking schemes for Economics evaluations.
Additional Study Resources for Class 11
For peak performance in upcoming evaluations, integrate official Economics sample papers directly into your study schedule. Follow up your revision by attempting online MCQ tests for Chapter 06 Measures of Dispersion to refine calculation speed and precision.
FAQs
Our advanced study package for Chapter 06 Measures of Dispersion includes detailed concepts, diagrams, Mind Maps, and explanation of complex topics to ensure Class 11 students learn as per syllabus for 2026 exams.
The Mind Maps provided for Chapter 06 Measures of Dispersion act as visual anchors which will help faster recall during high-pressure exams.
Yes, teachers use our Class 11 Economics resources for lesson planning as they are in simple language and have lot of solved examples.
Yes, You can download the complete, mobile-friendly PDF of the Economics Chapter 06 Measures of Dispersion advanced resources for free.
Yes, our subject matter experts have updated the Chapter 06 Measures of Dispersion material to align with the rationalized NCERT textbooks and have removed deleted topics and added new competency-based questions.