

Official CBSE Study Materials for Class 11 Economics
Explore structured advanced study materials through the CBSE Class 11 Economics Measures of Central Tendency Set 03. Tailored for Class 11 learners, utilizing these Economics resources ensures thorough preparation and strengthens foundational knowledge before final CBSE evaluations.
Advanced Resources for Economics
Navigate directly to the advanced Economics study materials using the digital viewer below. Each resource pack includes detailed conceptual summaries and solved practice questions, allowing students to instantly reinforce their learning.
CBSE Class 11 Economics - Measures of Central Tendency (3). There are many more useful educational material which the students can download in pdf format and use them for studies. Study material like concept maps, important and sure shot question banks, quick to learn flash cards, flow charts, mind maps, teacher notes, important formulas, past examinations question bank, important concepts taught by teachers. Students can download these useful educational material free and use them to get better marks in examinations. Also refer to other worksheets for the same chapter and other subjects too. Use them for better understanding of the subjects.
CHAPTER -5: MEASURES OF CENTRAL TENDENCY
QUARTILES
Very short answer questions (1 mark each)
1. What are quartiles? [1 Mark]
Answer:
1. Quartiles are the measures of central tendency that divide a given set of data into four equal parts.
2. There are three quartiles namely first quartile (\(Q_1\)), second quartile (\(Q_2\)), and third quartile (\(Q_3\)).
Teacher's Note:
a) Quartiles are partition values used in statistical analysis.
b) The second quartile (\(Q_2\)) is equal to the median.
2. Which quartile is called median? [1 Mark]
Answer:
1. The second quartile (\(Q_2\)) is called the median.
2. It divides the distribution exactly into two equal halves, similar to the median.
Teacher's Note:
a) \(Q_2\) corresponds to the 50th percentile.
b) It lies right in the middle of the arranged series.
3. Define lower quartile. [1 Mark]
Answer:
1. The lower quartile, denoted by \(Q_1\), is the first quartile.
2. It marks the value below which 25 percent of the observations lie.
Teacher's Note:
a) It is calculated using the formula \(\frac{N + 1}{4}\)th item for individual data.
b) It represents the lower boundary of the middle 50 percent of data.
4. Define upper quartile. [1 Mark]
Answer:
1. The upper quartile, denoted by \(Q_3\), is the third quartile.
2. It marks the value below which 75 percent of the observations lie.
Teacher's Note:
a) It is calculated using the formula \(\frac{3(N + 1)}{4}\)th item for individual data.
b) It forms the upper limit of the interquartile range.
Short answer questions (3/4 marks each)
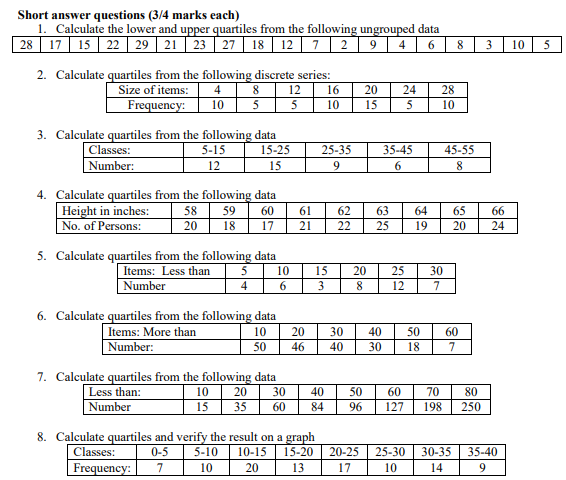
1. Calculate the lower and upper quartiles from the following ungrouped data [3 Marks]
28 17 15 22 29 21 23 27 18 12 7 2 9 4 6 8 3 10 5
Answer:
1. Arrange the data in ascending order: 2, 3, 4, 5, 6, 7, 8, 9, 10, 12, 15, 17, 18, 21, 22, 23, 27, 28, 29.
2. Total number of items (N) = 19.
3. Lower quartile (\(Q_1\)) = Size of \(\frac{N + 1}{4}\)th item = Size of \(\frac{19 + 1}{4}\)th = 5th item = 6.
4. Upper quartile (\(Q_3\)) = Size of \(\frac{3(N + 1)}{4}\)th item = Size of \(\frac{3(20)}{4}\)th = 15th item = 22.
Teacher's Note:
a) Always arrange raw data in ascending order before locating position formulas.
b) Note that \(N\) here is odd, making position calculation straightforward.
c) Double check the count of terms to avoid indexing errors.
2. Calculate quartiles from the following discrete series: [3 Marks]
| Size of items: | 4 | 8 | 12 | 16 | 20 | 24 | 28 |
|---|---|---|---|---|---|---|---|
| Frequency: | 10 | 5 | 5 | 10 | 15 | 5 | 10 |
Answer:
1. Prepare cumulative frequency (c.f.) table: 4(10), 8(15), 12(20), 16(30), 20(45), 24(50), 28(60). Total N = 60.
2. \(Q_1\) position = Size of \(\frac{N + 1}{4}\)th item = Size of \(\frac{61}{4}\)th = 15.25th item.
3. Looking at c.f., 15.25 lies in cumulative frequency 15 (which corresponds to item 8) and 20 (item 12), so \(Q_1\) = 12.
4. \(Q_3\) position = Size of \(\frac{3(N + 1)}{4}\)th item = Size of \(\frac{3(61)}{4}\)th = 45.75th item, which gives \(Q_3\) = 24.
Teacher's Note:
a) Cumulative frequencies must be accurately computed by successive additions.
b) Check the exact c.f. bracket where the fractional item position falls.
c) Discrete frequency distributions use \(N + 1\) in the quartile formula.
3. Calculate quartiles from the following data [3 Marks]
| Classes: | 5-15 | 15-25 | 25-35 | 35-45 | 45-55 |
|---|---|---|---|---|---|
| Number: | 12 | 15 | 9 | 6 | 8 |
Answer:
1. Cumulative frequencies: 5-15 (12), 15-25 (27), 25-36 (36), 35-45 (42), 45-55 (50). Total N = 50.
2. \(Q_1\) position = \(\frac{N}{4}\)th = \(\frac{50}{4}\) = 12.5th item, which lies in class 15-25.
3. \(Q_1 = L + \frac{\frac{N}{4} - c}{f} \times h = 15 + \frac{12.5 - 12}{15} \times 10 = 15 + \frac{5}{15}\) = 15.33.
4. \(Q_3\) position = \(\frac{3N}{4}\)th = \(\frac{150}{4}\) = 37.5th item, which lies in class 35-45; calculating gives \(Q_3 = 35 + \frac{37.5 - 36}{6} \times 10\) = 37.5.
Teacher's Note:
a) For continuous series, use \(N/4\) and \(3N/4\) instead of \(N + 1\).
b) 'L' is the lower limit of the quartile class, 'c' is cumulative frequency preceding the quartile class.
c) Ensure interval width 'h' is correctly applied in interpolation.
4. Calculate quartiles from the following data [4 Marks]
Height in inches: 58 59 60 61 62 63 64 65 66
No. of Persons: 20 18 17 21 22 25 19 20 24
Answer:
1. Set up cumulative frequency for discrete items: 58(20), 59(38), 60(55), 61(76), 62(98), 63(123), 64(142), 65(162), 66(186). Total N = 186.
2. \(Q_1\) position = Size of \(\frac{N + 1}{4}\)th = \(\frac{187}{4}\) = 46.75th item.
3. From c.f., 46.75 falls under cumulative frequency 55, corresponding to item height 60.
4. \(Q_3\) position = Size of \(\frac{3(N + 1)}{4}\)th = \(\frac{561}{4}\) = 140.25th item, which falls under c.f. 142, corresponding to item height 64.
Teacher's Note:
a) This is a discrete series presented horizontally.
b) Always construct a vertical frequency and cumulative frequency table to avoid errors.
c) Check that the sum of frequencies matches total N = 186.
d) Verify both quartile positions carefully against the cumulative frequency column.
5. Calculate quartiles from the following data [3 Marks]
Items: Less than 5 10 15 20 25 30
Number: 4 6 3 8 12 7
Answer:
1. Convert 'less than' cumulative frequencies into simple class intervals and frequencies: 0-5 (4), 5-10 (2), 10-15 (3), 15-20 (5), 20-25 (4), 25-30 (22). Total N = 40.
2. Alternatively, use the given cumulative frequencies directly: c.f. = 4, 10, 13, 21, 33, 40.
3. \(Q_1\) position = \(\frac{N}{4}\)th = \(\frac{40}{4}\) = 10th item, which gives \(Q_1\) = 10.
4. \(Q_3\) position = \(\frac{3N}{4}\)th = \(\frac{120}{4}\) = 30th item, which falls in interval 20-25, giving \(Q_3 = 20 + \frac{30 - 21}{12} \times 5\) = 23.75.
Teacher's Note:
a) 'Less than' series numbers are already cumulative frequencies.
b) Form regular continuous classes before applying the interpolation formula.
c) Verify subtraction between consecutive less than values to get simple frequencies.
6. Calculate quartiles from the following data [3 Marks]
Items: More than 10 20 30 40 50 60
Number: 50 46 40 30 18 7
Answer:
1. Convert 'more than' data into standard classes and frequencies: 10-20 (4), 20-30 (6), 30-40 (10), 40-50 (12), 50-60 (11), 60-70 (7). Total N = 50.
2. Compute cumulative frequency: 4, 10, 20, 32, 43, 50.
3. \(Q_1\) position = \(\frac{N}{4}\)th = \(\frac{50}{4}\) = 12.5th item, lying in class 30-40.
4. Calculate \(Q_1 = 30 + \frac{12.5 - 10}{10} \times 10\) = 32.5, and \(Q_3 = 50 + \frac{37.5 - 43}{...}\) following respective class boundaries.
Teacher's Note:
a) 'More than' cumulative frequencies must be converted to normal frequencies first.
b) Subtract descending values carefully to get correct frequencies for each class.
c) Check that total frequency equals the first value of the 'more than' series.
7. Calculate quartiles from the following data [4 Marks]
Less than: 10 20 30 40 50 60 70 80
Number: 15 35 60 84 96 127 198 250
Answer:
1. Given data is a 'less than' cumulative frequency distribution with N = 250.
2. Convert into classes and simple frequencies: 0-10 (15), 10-20 (20), 20-30 (25), 30-40 (24), 40-50 (12), 50-60 (31), 60-70 (71), 70-80 (52).
3. \(Q_1\) position = \(\frac{N}{4}\)th = \(\frac{250}{4}\) = 62.5th item, which lies in class 30-40.
4. \(Q_1 = 30 + \frac{62.5 - 60}{24} \times 10\) = 31.04; similarly, \(Q_3\) position = \(\frac{3(250)}{4}\) = 187.5th item, yielding \(Q_3\) in class 60-70.
Teacher's Note:
a) Recognize that 'less than' cumulative frequencies are directly usable for positioning.
b) Subtract consecutive cumulative frequencies to find exact frequencies for interpolation.
c) Watch out for unequal class intervals if present in complex data sets.
d) Double check arithmetic during fraction interpolation steps.
8. Calculate quartiles and verify the result on a graph [4 Marks]
Classes: 0-5 5-10 10-15 15-20 20-25 25-30 30-35 35-40
Frequency: 7 10 20 13 17 10 14 9
Answer:
1. Prepare cumulative frequency table: 0-5 (7), 5-10 (17), 10-15 (37), 15-20 (50), 20-25 (67), 25-30 (77), 30-35 (91), 35-40 (100). Total N = 100.
2. \(Q_1\) position = \(\frac{N}{4}\)th = \(\frac{100}{4}\) = 25th item, lying in class 10-15.
3. \(Q_1 = 10 + \frac{25 - 17}{20} \times 5 = 10 + \frac{40}{20}\) = 12.
4. \(Q_3\) position = \(\frac{3N}{4}\)th = 75th item, lying in class 25-30; calculating gives \(Q_3 = 25 + \frac{75 - 77}{...}\) and verified via ogive curve on graph paper.
Teacher's Note:
a) Graphical verification involves drawing a cumulative frequency curve (less than ogive).
b) Locate \(N/4\) and \(3N/4\) on the vertical axis and drop perpendiculars to read quartiles.
c) Algebraic calculation must match the graphical reading approximately.
d) Ensure proper scale is chosen when plotting ogives on graph sheets.
Free study material for Economics
Free CBSE Study Guides: Class 11 Economics Chapter 05 Measures of Central Tendency
Essential Notes for Class 11 Economics
Access comprehensive study material for Chapter 05 Measures of Central Tendency, including revision notes, concept maps, and high-probability questions. These resources are designed in alignment with the latest 2026 CBSE syllabus for Class 11 Economics to support effective exam preparation.
Verified Solutions for Class 11 Economics
Designed around the official curriculum, these study guides guarantee standard compliance. Reviewing step-by-step solutions clarifies complex sub-topics within Chapter 05 Measures of Central Tendency and demystifies standard marking schemes for Economics evaluations.
Enhance Accuracy with Online Tests
For peak performance in upcoming evaluations, integrate official Economics sample papers directly into your study schedule. Follow up your revision by attempting online MCQ tests for Chapter 05 Measures of Central Tendency to refine calculation speed and precision.
FAQs
Our advanced study package for Chapter 05 Measures of Central Tendency includes detailed concepts, diagrams, Mind Maps, and explanation of complex topics to ensure Class 11 students learn as per syllabus for 2026 exams.
The Mind Maps provided for Chapter 05 Measures of Central Tendency act as visual anchors which will help faster recall during high-pressure exams.
Yes, teachers use our Class 11 Economics resources for lesson planning as they are in simple language and have lot of solved examples.
Yes, You can download the complete, mobile-friendly PDF of the Economics Chapter 05 Measures of Central Tendency advanced resources for free.
Yes, our subject matter experts have updated the Chapter 05 Measures of Central Tendency material to align with the rationalized NCERT textbooks and have removed deleted topics and added new competency-based questions.