

Class 11 Economics Study Guide: CBSE Class 11 Economics Correlation
Explore structured advanced study materials through the CBSE Class 11 Economics Correlation. Tailored for Class 11 learners, utilizing these Economics resources ensures thorough preparation and strengthens foundational knowledge before final CBSE evaluations.
Download Chapter 06 Correlation Study Material PDF
Access the complete useful resource PDF for Class 11 Economics below. Regular practice with these targeted academic notes builds familiarity with complex topics and helps secure higher marks in final school evaluations.
CBSE Class 11 Economics - Correlation. There are many more useful educational material which the students can download in pdf format and use them for studies. Study material like concept maps, important and sure shot question banks, quick to learn flash cards, flow charts, mind maps, teacher notes, important formulas, past examinations question bank, important concepts taught by teachers. Students can download these useful educational material free and use them to get better marks in examinations. Also refer to other worksheets for the same chapter and other subjects too. Use them for better understanding of the subjects.
CHAPTER -7: CORRELATION
Very short answer questions (1 mark each)
1. Define Correlation [1 Mark]
Answer:
1. Correlation is a statistical technique that measures and analyzes the degree and direction of relationship between two or more variables.
2. It indicates whether changes in one variable are associated with changes in another variable.
Teacher's Note:
a) Mention that correlation measures association, not necessarily causation.
b) The correlation coefficient always lies between -1 and +1.
2. What do you mean by Positive Correlation? [1 Mark]
Answer:
1. Positive correlation occurs when two variables move in the same direction.
2. An increase in one variable leads to an increase in the other, and a decrease leads to a decrease.
Teacher's Note:
a) Price and supply usually show a positive correlation.
b) The correlation coefficient in this case is greater than zero.
3. Mention the type of correlation, if variable change in reverse direction but in equal proportions. [1 Mark]
Answer:
1. Perfect Negative Correlation.
2. The coefficient of correlation r is equal to -1.
Teacher's Note:
a) Reverse direction indicates negative correlation.
b) Equal proportions indicate it is perfect.
4. How is the problem of equal ranks solved? [1 Mark]
Answer:
1. By assigning the average of the ranks which they would have received if they had not been equal.
2. An adjustment factor \(\frac{m(m^2 - 1)}{12}\) is added to the numerator in Spearman's formula for each repeated rank.
Teacher's Note:
a) Here m represents the number of times an item is repeated.
b) This correction term ensures accuracy when values tie.
5. Explain the steps involved in the calculation of Karl Pearson's method of correlation. [1 Mark]
Answer:
1. Calculate the arithmetic mean for both X and Y series.
2. Take deviations of items from their respective means and apply the standard Pearson formula.
Teacher's Note:
a) Direct or shortcut methods can also be used based on data values.
b) Pearson method gives both the direction and numerical magnitude of linear relationship.
6. What are scatter diagrams? [1 Mark]
Answer:
1. A scatter diagram is a graphic method of studying correlation between two variables by plotting data points on a graph.
2. It gives a visual impression of the nature and degree of relationship between variables.
Teacher's Note:
a) Independent variable is plotted on the X-axis and dependent on the Y-axis.
b) It is a non-mathematical, preliminary tool.
7. Calculate the coefficient of correlation between price and quantity. [1 Mark]
Answer:
1. Due to insufficient data values given in this summary line, the correlation cannot be computed directly.
2. Generally, price and quantity exhibit a negative correlation coefficient.
Teacher's Note:
a) This question serves as an introductory placeholder in the exercise sheet.
b) Complete data series are provided in subsequent numerical questions.
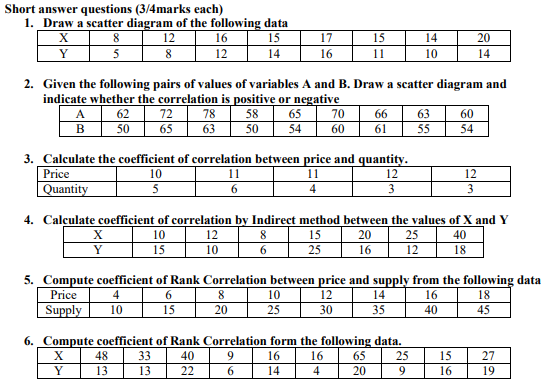
Short answer questions (3/4marks each)
1. Draw a scatter diagram of the following data [3 Marks]
| X | 8 | 12 | 16 | 15 | 17 | 15 | 14 | 20 |
|---|---|---|---|---|---|---|---|---|
| Y | 5 | 8 | 12 | 14 | 16 | 11 | 10 | 14 |
Answer:
1. Set up a Cartesian plane with X-axis representing variable X (ranging from 8 to 20) and Y-axis representing variable Y (ranging from 5 to 16).
2. Plot the given coordinate pairs: (8,5), (12,8), (16,12), (15,14), (17,16), (15,11), (14,10), and (20,14).
3. Observe that the plotted points show an upward trend from bottom-left to top-right, indicating positive correlation.
Teacher's Note:
a) Label both axes clearly with variable names and appropriate scales.
b) A scatter diagram provides a quick visual check for linear or non-linear association.
c) The upward slope confirms that high X values correspond generally to high Y values.
2. Given the following pairs of values of variables A and B. Draw a scatter diagram and indicate whether the correlation is positive or negative [4 Marks]
| A | 62 | 72 | 78 | 58 | 65 | 70 | 66 | 63 | 60 |
|---|---|---|---|---|---|---|---|---|---|
| B | 50 | 65 | 63 | 50 | 54 | 60 | 61 | 55 | 54 |
Answer:
1. Plot variable A on the horizontal axis and variable B on the vertical axis with proper scale.
2. Plot all 9 pairs of points: (62,50), (72,65), (78,63), (58,50), (65,54), (70,60), (66,61), (63,55), (60,54).
3. Examine the direction of the scatter plot points across the graph grid.
4. Since the points generally rise from left to right, the correlation is positive.
Teacher's Note:
a) Ensure correct axis selection where independent variable is on X-axis.
b) Clustering of points around an imaginary upward line confirms the positive trend.
c) Check plot coordinates carefully before concluding direction.
d) Graphical methods are subjective, hence verified by numerical coefficients.
3. Calculate the coefficient of correlation between price and quantity. [4 Marks]
| Price | 10 | 11 | 11 | 12 | 12 |
|---|---|---|---|---|---|
| Quantity | 5 | 6 | 4 | 3 | 3 |
Answer:
1. Let Price = X and Quantity = Y. Number of pairs N = 5.
2. \(\sum X\) = 10 + 11 + 11 + 12 + 12 = 56, \(\sum Y\) = 5 + 6 + 4 + 3 + 3 = 21.
3. \(\sum X^2\) = 100 + 121 + 121 + 144 + 144 = 630, \(\sum Y^2\) = 25 + 36 + 16 + 9 + 9 = 95, \(\sum XY\) = 50 + 66 + 44 + 36 + 36 = 232.
4. Apply Karl Pearson formula r = \(\frac{N \sum XY - (\sum X)(\sum Y)}{\sqrt{N \sum X^2 - (\sum X)^2} \sqrt{N \sum Y^2 - (\sum Y)^2}}\).
5. r = \(\frac{5(232) - (56)(21)}{\sqrt{5(630) - (56)^2} \sqrt{5(95) - (21)^2}}\) = \(\frac{1160 - 1176}{\sqrt{3150 - 3136} \sqrt{475 - 441}}\) = \(\frac{-16}{\sqrt{14} \sqrt{34}}\) = \(\frac{-16}{3.741 \times 5.831}\) = \(\frac{-16}{21.815}\) = -0.733.
Teacher's Note:
a) Negative coefficient aligns with the law of demand where price and quantity move inversely.
b) Double-check summation calculations for X squared and XY cross products.
c) Watch out for rounding off intermediate square root values.
d) Pearson coefficient values always range between -1 and +1.
4. Calculate coefficient of correlation by Indirect method between the values of X and Y [4 Marks]
| X | 10 | 12 | 8 | 15 | 20 | 25 | 40 |
|---|---|---|---|---|---|---|---|
| Y | 15 | 10 | 6 | 25 | 16 | 12 | 18 |
Answer:
1. Let N = 7. Take assumed means \(A_x\) = 15 and \(A_y\) = 15.
2. Find dx = X - 15: -5, -3, -7, 0, 5, 10, 25; \(\sum dx\) = 25.
3. Find dy = Y - 15: 0, -5, -9, 10, 1, -3, 3; \(\sum dy\) = 7.
4. Find \(dx^2\): 25, 9, 49, 0, 25, 100, 625; \(\sum dx^2\) = 833.
5. Find \(dy^2\): 0, 25, 81, 100, 1, 9, 9; \(\sum dy^2\) = 225.
6. Find \(dx dy\): 0, 15, 63, 0, 5, -30, 75; \(\sum dxdy\) = 128.
7. Apply formula r = \(\frac{N \sum dxdy - (\sum dx)(\sum dy)}{\sqrt{N \sum dx^2 - (\sum dx)^2} \sqrt{N \sum dy^2 - (\sum dy)^2}}\) = \(\frac{7(128) - (25)(7)}{\sqrt{7(833) - (25)^2} \sqrt{7(225) - (7)^2}}\) = \(\frac{896 - 175}{\sqrt{5831 - 625} \sqrt{1575 - 49}}\) = \(\frac{721}{\sqrt{5206} \sqrt{1526}}\) = \(\frac{721}{72.15 \times 39.06}\) = \(\frac{721}{2818.18}\) = 0.256.
Teacher's Note:
a) The indirect method using assumed mean simplifies calculations when actual means are fractions.
b) Ensure correct signs are maintained during multiplication of deviations.
c) The positive value indicates a weak positive correlation between X and Y.
d) Double-check all arithmetic operations to avoid common calculation errors.
5. Compute coefficient of Rank Correlation between price and supply from the following data [4 Marks]
| Price | 4 | 6 | 8 | 10 | 12 | 14 | 16 | 18 |
|---|---|---|---|---|---|---|---|---|
| Supply | 10 | 15 | 20 | 25 | 30 | 35 | 40 | 45 |
Answer:
1. Let Price = X and Supply = Y. Number of observations N = 8.
2. Assign ranks to X in descending order (highest = rank 1): Ranks \(R_1\) = 8, 7, 6, 5, 4, 3, 2, 1.
3. Assign ranks to Y in descending order (highest = rank 1): Ranks \(R_2\) = 8, 7, 6, 5, 4, 3, 2, 1.
4. Calculate difference d = \(R_1 - R_2\) = 0 for all pairs; \(\sum d^2\) = 0.
5. Apply Spearman's Rank Correlation formula \(r_k = 1 - \frac{6 \sum d^2}{N(N^2 - 1)}\).
6. \(r_k = 1 - \frac{6(0)}{8(64 - 1)} = 1 - 0 = 1\).
Teacher's Note:
a) Perfect positive rank correlation is obtained because both variables increase in exact uniform order.
b) Ascending or descending ranking order must be kept uniform for both variables.
c) Since there are no tied ranks, no correction factor is required.
d) Spearman's formula is simpler to apply when actual quantitative values are converted to ranks.
6. Compute coefficient of Rank Correlation form the following data. [4 Marks]
| X | 48 | 33 | 40 | 9 | 16 | 16 | 65 | 25 | 15 | 27 |
|---|---|---|---|---|---|---|---|---|---|---|
| Y | 13 | 13 | 22 | 6 | 14 | 4 | 20 | 9 | 16 | 19 |
Answer:
1. Number of observations N = 10. Assign descending ranks to X: values (65, 48, 40, 33, 27, 25, 16, 16, 15, 9) get ranks \(R_1\) = (1, 2, 3, 4, 5, 6, 7.5, 7.5, 9, 10) since 16 repeats twice.
2. Assign descending ranks to Y: values (22, 20, 19, 16, 14, 13, 13, 9, 6, 4) get ranks \(R_2\) = (1, 2, 3, 4, 5, 6.5, 6.5, 8, 9, 10) since 13 repeats twice.
3. Compute differences d = \(R_1 - R_2\) and \(d^2\):
For X=48(R1=2), Y=13(R2=6.5) -> d = -4.5, \(d^2\) = 20.25
For X=33(R1=4), Y=13(R2=6.5) -> d = -2.5, \(d^2\) = 6.25
For X=40(R1=3), Y=22(R2=1) -> d = 2, \(d^2\) = 4
For X=9(R1=10), Y=6(R2=9) -> d = 1, \(d^2\) = 1
For X=16(R1=7.5), Y=14(R2=5) -> d = 2.5, \(d^2\) = 6.25
For X=16(R1=7.5), Y=4(R2=10) -> d = -2.5, \(d^2\) = 6.25
For X=65(R1=1), Y=20(R2=2) -> d = -1, \(d^2\) = 1
For X=25(R1=6), Y=9(R2=8) -> d = -2, \(d^2\) = 4
For X=15(R1=9), Y=16(R2=4) -> d = 5, \(d^2\) = 25
For X=27(R1=5), Y=19(R2=3) -> d = 2, \(d^2\) = 4
4. Sum of \(d^2\) = 20.25 + 6.25 + 4 + 1 + 6.25 + 6.25 + 1 + 4 + 25 + 4 = 78.25.
5. Correction factors for tied ranks: For X, value 16 repeats 2 times (\(m_1\) = 2). For Y, value 13 repeats 2 times (\lambda = 2). Total correction term \(\sum \frac{m(m^2-1)}{12}\) = \(\frac{2(2^2-1)}{12} + \frac{2(2^2-1)}{12}\) = 0.5 + 0.5 = 1.0.
6. Apply modified Spearman formula: \(r_k = 1 - \frac{6 \left( \sum d^2 + \frac{m_1(m_1^2-1)}{12} + \dots \right)}{N(N^2 - 1)}\) = \(1 - \frac{6(78.25 + 1.0)}{10(100 - 1)}\) = \(1 - \frac{6(79.25)}{990}\) = \(1 - \frac{475.5}{990}\) = 1 - 0.480 = 0.520.
Teacher's Note:
a) Tied ranks require adding correction terms to the numerator based on frequency of repetition.
b) Rank 7.5 for X=16 is the average of ranks 7 and 8.
c) Rank 6.5 for Y=13 is the average of ranks 6 and 7.
d) The resulting positive value indicates a moderate positive rank correlation between the datasets.
Free study material for Economics
CBSE Class 11 Economics Study Material: Chapter 06 Correlation
Comprehensive Study Resources for Chapter 06 Correlation
Explore essential learning tools for Class 11 Economics Chapter 06 Correlation. This curated collection features in-depth notes and targeted practice questions built around the active 2026 curriculum to streamline your daily revision.
Understanding Marking Schemes
Each resource draws directly from authorized textbooks to maintain academic accuracy. Evaluating solved examples allows Class 11 students to master the formal presentation and answer-writing standards expected in upcoming school exams.
Complete Revision for Economics
Wrap up your chapter revision by testing your knowledge against standard objective question formats. Explore our full library of free, up-to-date sample papers and online assessments to secure top grades in your CBSE examinations.
FAQs
Our advanced study package for Chapter 06 Correlation includes detailed concepts, diagrams, Mind Maps, and explanation of complex topics to ensure Class 11 students learn as per syllabus for 2026 exams.
The Mind Maps provided for Chapter 06 Correlation act as visual anchors which will help faster recall during high-pressure exams.
Yes, teachers use our Class 11 Economics resources for lesson planning as they are in simple language and have lot of solved examples.
Yes, You can download the complete, mobile-friendly PDF of the Economics Chapter 06 Correlation advanced resources for free.
Yes, our subject matter experts have updated the Chapter 06 Correlation material to align with the rationalized NCERT textbooks and have removed deleted topics and added new competency-based questions.