

Advanced Study Material for Class 11 Economics: Chapter 05 Measures of Central Tendency
Explore structured advanced study materials through the CBSE Class 11 Economics Measures of Central Tendency Set 02. Tailored for Class 11 learners, utilizing these Economics resources ensures thorough preparation and strengthens foundational knowledge before final CBSE evaluations.
Practice Class 11 Economics Resources: Chapter 05 Measures of Central Tendency
View or download the dedicated CBSE Class 11 Economics Measures of Central Tendency Set 02 resource below. Engaging with these advanced study guides under focused conditions ensures continuous academic progress and mastery of the 2026-27 curriculum for Chapter 05 Measures of Central Tendency.
CBSE Class 11 Economics Measures of Central Tendency (2). Please refer to the examination notes which you can use for preparing and revising for exams. These notes will help you to revise the concepts quickly and get good marks.
CHAPTER - 5: MEASURES OF CENTRAL TENDENCY
MEDIAN
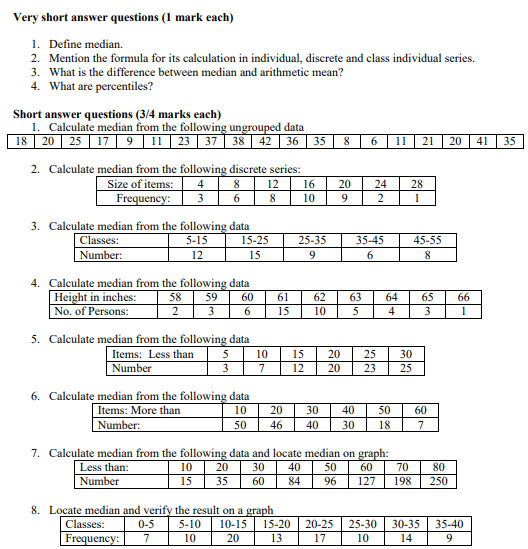
Very short answer questions (1 mark each)
1. Define median. [1 Mark]
Answer:
1. Median is the middle value of a series when the data is arranged in ascending or descending order of magnitude.
2. It divides the total data set into two equal halves.
Teacher's Note:
a) It is a positional average.
b) Extreme values do not affect median.
2. Mention the formula for its calculation in individual, discrete and class individual series. [1 Mark]
Answer:
1. Individual series: Median = size of \(\left(\frac{n + 1}{2}\right)\)th item.
2. Discrete series: Median = size of \(\left(\frac{n + 1}{2}\right)\)th item.
3. Continuous series: Median = \(l_1 + \left(\frac{\frac{N}{2} - cf}{f}\right) \times i\).
Teacher's Note:
a) Here n represents total number of observations or cumulative frequency total N.
b) Always remember to arrange data in ascending order before applying formulas.
3. What is the difference between median and arithmetic mean? [1 Mark]
Answer:
1. Arithmetic mean is a mathematical average based on all observations, whereas median is a positional average based on the middle position.
2. Mean is affected by extreme values, while median is not.
Teacher's Note:
a) Mean uses the sum of all values divided by count.
b) Median focuses strictly on the central position.
4. What are percentiles? [1 Mark]
Answer:
1. Percentiles are partition values that divide a given series into one hundred equal parts.
2. There are 99 percentiles denoted by P1, P2, up to P99.
Teacher's Note:
a) Percentiles are used to determine relative standing in a large data distribution.
b) The 50th percentile corresponds exactly to the median.
Short answer questions (3/4 marks each)
1. Calculate median from the following ungrouped data [3 Marks]
18 20 25 17 9 11 23 37 38 42 36 35 8 6 11 21 20 41 35
Answer:
1. Arrange the given 19 items in ascending order: 6, 8, 9, 11, 11, 17, 18, 20, 20, 21, 23, 25, 35, 35, 36, 37, 38, 41, 42.
2. Total number of items (n) = 19.
3. Median = size of \(\left(\frac{n + 1}{2}\right)\)th item = size of \(\left(\frac{19 + 1}{2}\right)\)th = 10th item.
4. The 10th item in the arranged series is 21.
Teacher's Note:
a) Always count the number of items carefully to avoid missing any observation.
b) Sorting data correctly is the most crucial step in positional statistics.
c) Since n is odd, a single middle value is obtained directly.
2. Calculate median from the following discrete series: [3 Marks]
| Size of items | 4 | 8 | 12 | 16 | 20 | 24 | 28 |
|---|---|---|---|---|---|---|---|
| Frequency | 3 | 6 | 8 | 10 | 9 | 2 | 1 |
Answer:
1. Construct cumulative frequencies (cf): 3, 9, 17, 27, 36, 38, 39. Total frequency (N) = 39.
2. Median position = \(\left(\frac{N + 1}{2}\right)\) = \(\left(\frac{39 + 1}{2}\right)\) = 20th item.
3. Looking at the cumulative frequency column, the 20th item falls within the cumulative frequency 27.
4. The corresponding size of the item is 16. Hence, median = 16.
Teacher's Note:
a) Cumulative frequency helps locate the exact position in discrete distributions.
b) Verify that the last cumulative frequency matches the sum of frequencies N.
c) Check that the size of items is strictly in ascending order before proceeding.
3. Calculate median from the following data [3 Marks]
| Classes | 5-15 | 15-25 | 25-35 | 35-45 | 45-55 |
|---|---|---|---|---|---|
| Number | 12 | 15 | 9 | 6 | 8 |
Answer:
1. Cumulative frequencies (cf): 12, 27, 36, 42, 50. Total N = 50.
2. Find \(\frac{N}{2}\) = \(\frac{50}{2}\) = 25.
3. Median class is 15-25 since its cumulative frequency 27 just exceeds 25.
4. Apply formula: Median = \(l_1 + \left(\frac{\frac{N}{2} - cf}{f}\right) \times i\) = \(15 + \left(\frac{25 - 12}{15}\right) \times 10\) = \(15 + \left(\frac{13}{15}\right) \times 10\) = \(15 + 8.67\) = 23.67.
Teacher's Note:
a) Here \(l_1\) = 15, cf = 12, f = 15, and class interval i = 10.
b) Ensure the class intervals are continuous before applying the formula.
c) Double check subtraction inside the numerator.
4. Calculate median from the following data [3 Marks]
| Height in inches | 58 | 59 | 60 | 61 | 62 | 63 | 64 | 65 | 66 |
|---|---|---|---|---|---|---|---|---|---|
| No. of Persons | 2 | 3 | 6 | 15 | 10 | 5 | 4 | 3 | 1 |
Answer:
1. Cumulative frequencies (cf): 2, 5, 11, 26, 36, 41, 45, 48, 49. Total N = 49.
2. Median position = \(\left(\frac{N + 1}{2}\right)\) = \(\left(\frac{49 + 1}{2}\right)\) = 25th item.
3. Looking at the cumulative frequency, the 25th item falls inside the cumulative frequency 26.
4. The corresponding height is 61 inches. Hence, median = 61.
Teacher's Note:
a) This is a discrete series presented horizontally.
b) Verify that the frequencies add up correctly to 49.
c) The correct corresponding size is directly read from the table row.
5. Calculate median from the following data [4 Marks]
| Items | Less than 5 | 10 | 15 | 20 | 25 | 30 |
|---|---|---|---|---|---|---|
| Number | 3 | 7 | 12 | 20 | 23 | 25 |
Answer:
1. Convert the 'less than' cumulative frequency into regular class intervals with frequencies: 0-5 (3), 5-10 (4), 10-15 (5), 15-20 (8), 20-25 (3), 25-30 (2).
2. Cumulative frequencies (cf): 3, 7, 12, 20, 23, 25. Total N = 25.
3. Find \(\frac{N}{2}\) = \(\frac{25}{2}\) = 12.5. The median class is 15-20.
4. Apply formula: Median = \(l_1 + \left(\frac{\frac{N}{2} - cf}{f}\right) \times i\) = \(15 + \left(\frac{12.5 - 12}{8}\right) \times 5\) = \(15 + \left(\frac{0.5}{8}\right) \times 5\) = \(15 + 0.3125\) = 15.31.
Teacher's Note:
a) 'Less than' series must first be converted into exclusive class intervals with individual frequencies.
b) Here \(l_1\) = 15, cf = 12, f = 8, and class interval i = 5.
c) Check interval width carefully; uniform class intervals make calculations easier.
d) Calculation of decimal fractions should be precise up to two decimal places.
6. Calculate median from the following data [4 Marks]
| Items | More than 10 | 20 | 30 | 40 | 50 | 60 |
|---|---|---|---|---|---|---|
| Number | 50 | 46 | 40 | 30 | 18 | 7 |
Answer:
1. Convert 'more than' cumulative frequencies into regular class intervals with frequencies: 10-20 (4), 20-30 (6), 30-40 (10), 40-50 (12), 50-60 (11), 60-70 (7).
2. Cumulative frequencies (cf): 4, 10, 20, 32, 43, 50. Total N = 50.
3. Find \(\frac{N}{2}\) = \(\frac{50}{2}\) = 25. The median class is 30-40.
4. Apply formula: Median = \(l_1 + \left(\frac{\frac{N}{2} - cf}{f}\right) \times i\) = \(30 + \left(\frac{25 - 20}{12}\right) \times 10\) = \(30 + \left(\frac{5}{12}\right) \times 10\) = \(30 + 4.17\) = 34.17.
Teacher's Note:
a) 'More than' frequencies must be subtracted consecutively to get simple frequencies.
b) Total N is given by the first value in the 'more than' frequency table (50).
c) Here \(l_1\) = 30, cf = 20, f = 12, and i = 10.
d) Double check subtraction steps during frequency conversion.
7. Calculate median from the following data and locate median on graph: [4 Marks]
| Less than | 10 | 10 | 20 | 30 | 40 | 50 | 60 | 70 | 80 |
|---|---|---|---|---|---|---|---|---|---|
| Number | 15 | 35 | 60 | 84 | 96 | 127 | 198 | 250 |
Answer:
1. Total N = 250.
2. Find \(\frac{N}{2}\) = \(\frac{250}{2}\) = 125.
3. Looking at cumulative frequencies, 125 lies in the class 50-60 (cf = 127, preceding cf = 96, f = 31).
4. Median = \(50 + \left(\frac{125 - 96}{31}\right) \times 10\) = \(50 + \left(\frac{29}{31}\right) \times 10\) = \(50 + 9.35\) = 59.35.
5. Graphical location: Plot 'less than' cumulative frequencies against upper limits to form an ogive curve, locate 125 on the y-axis, draw a perpendicular to the curve, and drop down to read the median value on the x-axis.
Teacher's Note:
a) For 'less than' ogive, plot upper limits on the x-axis and cumulative frequencies on the y-axis.
b) The point \(\frac{N}{2}\) on the cumulative frequency axis gives the median graphically.
c) Make sure class intervals are properly formed from the given data.
d) Graphical verification confirms the mathematical calculation.
8. Locate median and verify the result on a graph [4 Marks]
| Classes | 0-5 | 5-10 | 10-15 | 15-20 | 20-25 | 25-30 | 30-35 | 35-40 |
|---|---|---|---|---|---|---|---|---|
| Frequency | 7 | 10 | 20 | 13 | 17 | 10 | 14 | 9 |
Answer:
1. Cumulative frequencies (cf): 7, 17, 37, 50, 67, 77, 91, 100. Total N = 100.
2. Find \(\frac{N}{2}\) = \(\frac{100}{2}\) = 50. The median class is 15-20 (cf = 50, preceding cf = 37, f = 13, i = 5).
3. Median = \(15 + \left(\frac{50 - 37}{13}\right) \times 5\) = \(15 + \left(\frac{13}{13}\right) \times 5\) = 15 + 5 = 20.
4. Graphical verification: Construct both 'less than' and 'more than' ogives, or draw a 'less than' ogive, and locate 50 on the cumulative frequency axis to verify the median value of 20 on the x-axis.
Teacher's Note:
a) When cf exactly matches \(\frac{N}{2}\), the median falls on the upper limit of that class.
b) Graphical intersection of 'less than' and 'more than' ogives also yields the median.
c) Always label axes clearly when sketching statistical graphs.
d) Double check addition of frequencies to ensure N = 100.
Free study material for Economics
Economics Class 11 Exam Resources: Chapter 05 Measures of Central Tendency
Comprehensive Study Resources for Chapter 05 Measures of Central Tendency
Review targeted study resources for Chapter 05 Measures of Central Tendency tailored for Class 11 learners. Utilizing these structured notes and quick-revision tools ensures complete alignment with current CBSE evaluation standards.
Understanding Marking Schemes
Each resource draws directly from authorized textbooks to maintain academic accuracy. Evaluating solved examples allows Class 11 students to master the formal presentation and answer-writing standards expected in upcoming school exams.
Complete Revision for Economics
Wrap up your chapter revision by testing your knowledge against standard objective question formats. Explore our full library of free, up-to-date sample papers and online assessments to secure top grades in your CBSE examinations.
FAQs
Our advanced study package for Chapter 05 Measures of Central Tendency includes detailed concepts, diagrams, Mind Maps, and explanation of complex topics to ensure Class 11 students learn as per syllabus for 2026 exams.
The Mind Maps provided for Chapter 05 Measures of Central Tendency act as visual anchors which will help faster recall during high-pressure exams.
Yes, teachers use our Class 11 Economics resources for lesson planning as they are in simple language and have lot of solved examples.
Yes, You can download the complete, mobile-friendly PDF of the Economics Chapter 05 Measures of Central Tendency advanced resources for free.
Yes, our subject matter experts have updated the Chapter 05 Measures of Central Tendency material to align with the rationalized NCERT textbooks and have removed deleted topics and added new competency-based questions.