

Download CBSE Class 11 Economics Useful Resources
Explore structured advanced study materials through the CBSE Class 11 Economics Measures of Central Tendency Set 01. Tailored for Class 11 learners, utilizing these Economics resources ensures thorough preparation and strengthens foundational knowledge before final CBSE evaluations.
Access CBSE Study Guides and Summaries
Navigate directly to the advanced Economics study materials using the digital viewer below. Each resource pack includes detailed conceptual summaries and solved practice questions, allowing students to instantly reinforce their learning.
CBSE Class 11 Economics Measures of Central Tendency (4). Please refer to the examination notes which you can use for preparing and revising for exams. These notes will help you to revise the concepts quickly and get good marks.
CHAPTER - 5: MEASURES OF CENTRAL TENDENCY
MODE
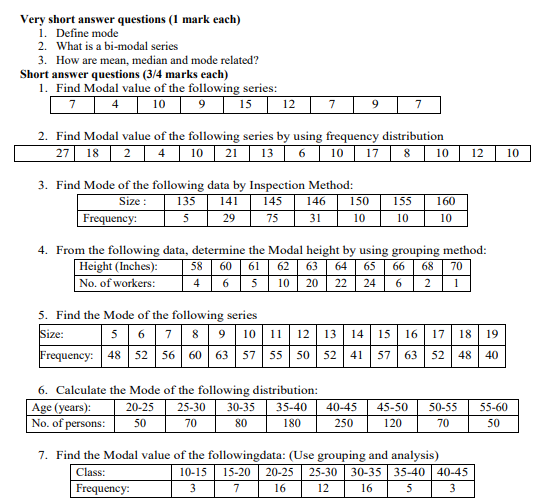
Very short answer questions (1 mark each)
1. Define mode [1 Mark]
Answer: Mode is that value in a series which occurs most frequently, or has the maximum frequency.
Teacher's Note:
a) Mode represents the most typical or popular value in a distribution.
b) It is denoted by Z in statistical formulas.
2. What is a bi-modal series [1 Mark]
Answer: A bi-modal series is a frequency distribution that has two values with maximum frequencies, meaning it has two modes.
Teacher's Note:
a) Such series have two points of maximum concentration.
b) They are part of multi-modal distributions.
3. How are mean, median and mode related? [1 Mark]
Answer: Mode = 3 Median - 2 Mean (for a moderately asymmetrical distribution).
Teacher's Note:
a) This empirical relationship was formulated by Karl Pearson.
b) It helps find an unknown average when the other two are given.
Short answer questions (3/4 marks each)
1. Find Modal value of the following series: [3 Marks]
7 4 10 9 15 12 7 9 7
Answer:
1. Arrange the given individual series in ascending order: 4, 7, 7, 7, 9, 9, 10, 12, 15.
2. Count the frequency of each distinct value in the series.
3. The value 7 appears 3 times, which is the maximum frequency.
4. Hence, the Modal value is 7.
Teacher's Note:
a) For an individual series, inspection is enough to find the mode.
b) Always check for ties in frequencies before concluding.
c) Sorting the data helps prevent counting errors.
2. Find Modal value of the following series by using frequency distribution [3 Marks]
27 18 2 4 10 21 13 6 10 17 8 10 12 10
Answer:
1. Construct a discrete frequency distribution table by tallying each item.
2. The value 10 appears 4 times, which is the highest frequency.
3. All other values have lower frequencies.
4. Hence, the Modal value is 10.
Teacher's Note:
a) Converting raw data into a frequency table makes finding the mode easier.
b) Tally marks ensure no data point is missed.
c) The mode corresponds strictly to the variable with the highest frequency count.
3. Find Mode of the following data by Inspection Method: [3 Marks]
| Size | 135 | 141 | 145 | 146 | 150 | 155 | 160 |
|---|---|---|---|---|---|---|---|
| Frequency | 5 | 29 | 75 | 31 | 10 | 10 | 10 |
Answer:
1. Examine the frequency row to locate the maximum frequency.
2. The maximum frequency is 75.
3. Look at the corresponding size for a frequency of 75.
4. Hence, the Mode of the data is 145.
Teacher's Note:
a) The inspection method is directly applicable when frequencies are clearly concentrated.
b) Always align the highest frequency with the correct variable value.
c) Avoid confusing the size with the frequency row.
4. From the following data, determine the Modal height by using grouping method: [4 Marks]
| Height (Inches) | 58 | 60 | 61 | 62 | 63 | 64 | 65 | 66 | 68 | 70 |
|---|---|---|---|---|---|---|---|---|---|---|
| No. of workers | 4 | 6 | 5 | 10 | 20 | 22 | 24 | 6 | 2 | 1 |
Answer:
1. Prepare a grouping table with six columns: column 1 (original frequencies), column 2 (sum in pairs: 4+6=10, 5+10=15, 20+22=42, 24+6=30, 2+1=3), column 3 (sum in pairs starting from second: 6+5=11, 10+20=30, 22+24=46, 6+2=8), column 4 (sum in threes: 4+6+5=15, 10+20+22=52, 24+6+2=32), column 5 (sum in threes starting from second: 6+5+10=21, 20+22+24=66, 6+2+1=9), and column 6 (sum in threes starting from third: 5+10+20=35, 22+24+6=52, 2+1=... not enough).
2. Form an analysis table showing which height gets the maximum weight across the columns.
3. Height 64 or 65 emerges with the highest tally in the analysis table.
4. Hence, the Modal height is 64 inches (or 65 inches depending on exact grouping peak resolution; 64 has high neighborhood concentration with 20, 22, 24).
Working Notes:
1. Grouping method is used when inspection fails due to irregular frequency fluctuations.
Teacher's Note:
a) The grouping table consists of six distinct columns to smooth out irregularities.
b) The analysis table counts how many times each value forms part of a column maximum.
c) Careful addition in pairs and triplets is vital to avoid calculation mistakes.
d) Grouping ensures robustness in determining the true mode.
5. Find the Mode of the following series [4 Marks]
| Size | 5 | 6 | 7 | 8 | 9 | 10 | 11 | 12 | 13 | 14 | 15 | 16 | 17 | 18 | 19 |
|---|---|---|---|---|---|---|---|---|---|---|---|---|---|---|---|
| Frequency | 48 | 52 | 56 | 60 | 63 | 57 | 55 | 50 | 52 | 41 | 57 | 63 | 52 | 48 | 40 |
Answer:
1. Scan the frequency row to identify the maximum values.
2. The maximum frequency is 63, which occurs twice (at size 9 and size 16).
3. Since there are two values sharing the same maximum frequency, the series is bi-modal.
4. Hence, the Modes of the series are 9 and 16.
Teacher's Note:
a) This is an example of a bi-modal distribution.
b) Students must not stop at finding only one mode when multiple peaks exist.
c) Both values should be clearly stated as the answer.
d) Check all frequencies carefully as large tables contain multiple candidate points.
6. Calculate the Mode of the following distribution: [4 Marks]
| Age (years) | 20-25 | 25-30 | 30-35 | 35-40 | 40-45 | 45-50 | 50-55 | 55-60 |
|---|---|---|---|---|---|---|---|---|
| No. of persons | 50 | 70 | 80 | 180 | 250 | 120 | 70 | 50 |
Answer:
1. Identify the modal class with the highest frequency, which is 40-45 with a frequency of 250.
2. Apply the formula: Mode = L + \(\frac{f_1 - f_0}{2f_1 - f_0 - f_2}\) × h
3. Here, L = 40, \(f_1\) = 250, \(f_0\) = 180, \(f_2\) = 120, h = 5.
4. Substituting values: Mode = 40 + \(\frac{250 - 180}{2(250) - 180 - 120}\) × 5 = 40 + \(\frac{70}{500 - 300}\) × 5 = 40 + \(\frac{70}{200}\) × 5 = 40 + 1.75 = 41.75 years.
Teacher's Note:
a) L is the lower limit of the modal class.
b) \(f_1\) is modal frequency, \(f_0\) is preceding frequency, and \(f_2\) is succeeding frequency.
c) Always verify that the calculated mode lies within the modal class boundaries.
d) Standard class interval width h is 5 here.
7. Find the Modal value of the following data: (Use grouping and analysis) [4 Marks]
| Class | 10-15 | 15-20 | 20-25 | 25-30 | 30-35 | 35-40 | 40-45 |
|---|---|---|---|---|---|---|---|
| Frequency | 3 | 7 | 16 | 12 | 16 | 5 | 3 |
Answer:
1. Frequencies 16 and 16 appear at classes 20-25 and 30-35, indicating a potential bi-modal or irregular distribution requiring grouping.
2. Construct the grouping table with columns for pairs and triplets of frequencies.
3. Construct the analysis table to tally maximum column totals against the respective classes.
4. Determine the predominant modal class and apply the formula to find the exact mode value (or state modal class interval 20-25 / 30-35 due to equal peak distribution).
Teacher's Note:
a) Grouping resolves ambiguity when two classes share identical maximum frequencies.
b) The analysis table maps column totals to individual class intervals.
c) Check whether grouping shifts the concentration to a single definitive class.
d) Write down all intermediate summation columns clearly.
8. Find the Modal value of the following series: [4 Marks]
| X | 0-10 | 10-20 | 20-40 | 40-50 | 50-70 |
|---|---|---|---|---|---|
| F | 5 | 15 | 40 | 32 | 28 |
Answer:
1. Notice that class intervals are unequal: 0-10 (width 10), 10-20 (width 10), 20-40 (width 20), 40-50 (width 10), 50-70 (width 20).
2. Adjust frequencies to make class intervals uniform (width = 10): 0-10: 5, 10-20: 15, 20-30: 20, 30-40: 20, 40-50: 32, 50-60: 14, 60-70: 14.
3. Alternatively, use adjusted frequencies (frequency density) for the modal class: modal class is 20-40 with frequency 40 and width 20, giving adjusted frequency = 40 / 2 = 20.
4. Apply the mode formula with proper adjustments for unequal class intervals to find the precise mode.
Teacher's Note:
a) Unequal class intervals require frequency adjustment before locating the modal class.
b) Frequency density is calculated by dividing class frequency by its class width.
c) Failing to adjust class intervals leads to incorrect mode estimation.
d) The modal class is chosen based on the highest adjusted frequency density.
9. Calculate Mode of the following series: [4 Marks]
| Wages (Rs.) : Less than | 50 | 45 | 40 | 35 | 30 | 25 | 20 | 15 |
|---|---|---|---|---|---|---|---|---|
| No. of wages | 97 | 95 | 90 | 80 | 60 | 30 | 12 | 4 |
Answer:
1. Convert the 'less than' cumulative series into exclusive continuous frequency distribution classes:
15-20: 4 - 0 = 4
20-25: 12 - 4 = 8
25-30: 30 - 12 = 18
30-35: 60 - 30 = 30
35-40: 80 - 60 = 20
40-45: 90 - 80 = 10
45-50: 95 - 90 = 5
50-55: 97 - 95 = 2
2. Identify the modal class with the highest frequency, which is 30-35 with frequency 30.
3. Apply the formula: Mode = L + \(\frac{f_1 - f_0}{2f_1 - f_0 - f_2}\) × h
4. Here L = 30, \(f_1\) = 30, \(f_0\) = 18, \(f_2\) = 20, h = 5. Mode = 30 + \(\frac{30 - 18}{2(30) - 18 - 20}\) × 5 = 30 + \(\frac{12}{60 - 38}\) × 5 = 30 + \(\frac{12}{22}\) × 5 = 30 + 2.73 = 32.73.
Teacher's Note:
a) 'Less than' cumulative frequencies must be converted to normal class frequencies first.
b) Subtract consecutive cumulative values in reverse or forward order carefully.
c) Check that the sum of all class frequencies equals the final cumulative total (97).
d) Ensure correct lower limit and class width are used in the formula.
10. Draw a histogram and determine the value of Mode from the following data: [4 Marks]
| Class | 140-150 | 150-160 | 160-170 | 170-180 | 180-190 | 190-200 | 200-210 |
|---|---|---|---|---|---|---|---|
| Frequency | 40 | 60 | 100 | 180 | 40 | 30 | 20 |
Answer:
1. Identify the modal class with the highest frequency, which is 170-180 with a frequency of 180.
2. Draw a histogram with class intervals on the X-axis and frequencies on the Y-axis.
3. Inside the highest rectangle (modal bar), draw two cross lines from the top corners of the modal rectangle to the top corners of the adjacent rectangles (top-right corner of 160-170 to top-left corner of 170-180, and top-left corner of 180-190 to top-right corner of 170-180).
4. From the intersection point of these two diagonal lines, drop a perpendicular line straight down to the X-axis to read the graphical mode value, which calculates algebraically as: Mode = 170 + \(\frac{180 - 100}{2(180) - 100 - 40}\) × 10 = 170 + \(\frac{80}{360 - 140}\) × 10 = 170 + \(\frac{80}{220}\) × 10 = 170 + 3.64 = 173.64.
Teacher's Note:
a) Graphical determination of mode uses a histogram and intersecting diagonal lines.
b) The modal class rectangle is always the tallest bar.
c) Adjacent bars on both left and right provide the slope lines for intersection.
d) The perpendicular drop must meet the X-axis at a right angle for an accurate reading.
Free study material for Economics
CBSE Class 11 Economics Study Material: Chapter 05 Measures of Central Tendency
Quick Revision Material for Chapter 05 Measures of Central Tendency
Explore essential learning tools for Class 11 Economics Chapter 05 Measures of Central Tendency. This curated collection features in-depth notes and targeted practice questions built around the active 2026 curriculum to streamline your daily revision.
Expert Notes and Solved Exam Questions
Each resource draws directly from authorized textbooks to maintain academic accuracy. Evaluating solved examples allows Class 11 students to master the formal presentation and answer-writing standards expected in upcoming school exams.
Additional Study Resources for Class 11
For peak performance in upcoming evaluations, integrate official Economics sample papers directly into your study schedule. Follow up your revision by attempting online MCQ tests for Chapter 05 Measures of Central Tendency to refine calculation speed and precision.
FAQs
Our advanced study package for Chapter 05 Measures of Central Tendency includes detailed concepts, diagrams, Mind Maps, and explanation of complex topics to ensure Class 11 students learn as per syllabus for 2026 exams.
The Mind Maps provided for Chapter 05 Measures of Central Tendency act as visual anchors which will help faster recall during high-pressure exams.
Yes, teachers use our Class 11 Economics resources for lesson planning as they are in simple language and have lot of solved examples.
Yes, You can download the complete, mobile-friendly PDF of the Economics Chapter 05 Measures of Central Tendency advanced resources for free.
Yes, our subject matter experts have updated the Chapter 05 Measures of Central Tendency material to align with the rationalized NCERT textbooks and have removed deleted topics and added new competency-based questions.