
Get the most accurate NCERT Solutions for Class 8 Mathematics Chapter 15 Introduction To Graphs here. Updated for the 2026-27 academic session, these solutions are based on the latest NCERT textbooks for Class 8 Mathematics. Our expert-created answers for Class 8 Mathematics are available for free download in PDF format.
Detailed Chapter 15 Introduction To Graphs NCERT Solutions for Class 8 Mathematics
For Class 8 students, solving NCERT textbook questions is the most effective way to build a strong conceptual foundation. Our Class 8 Mathematics solutions follow a detailed, step-by-step approach to ensure you understand the logic behind every answer. Practicing these Chapter 15 Introduction To Graphs solutions will improve your exam performance.
Class 8 Mathematics Chapter 15 Introduction To Graphs NCERT Solutions PDF
Exercise 15.1
Q.1) The following graph shows the temperature of a patient in a hospital, recorded every hour:
(a) What was the patient’s temperature at 1 p.m.?
(b) When was the patient’s temperature 38.5° C?
(c) The patient’s temperature was the same two times during the period given. What were these two times?
(d) What was the temperature at 1.30 p.m.? How did you arrive at your answer?
(e) During which periods did the patients’ temperature showed an upward trend?
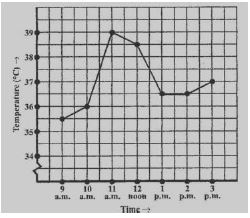
Sol.1) (a) The patient’s temperature was 36.5°𝐶 at 1 p.m.
(b) The patient’s temperature was 38. 5° 𝐶 at 12 noon.
(c) The patient’s temperature was same at 1 p.m. and 2 p.m.
(d) The temperature at 1.30 p.m. is 36. 5° 𝐶. The point between 1 p.m. and 2 p.m., -x axis is equidistant from the two points showing 1 p.m. and 2 p.m. So it represents 1.30 p.m. Similarly the point on axis, between 36° 𝐶 and 37°𝐶 will represent-y 36.5°𝐶.
(e) The patient’s temperature showed an upward trend from 9 a.m. to 11 a.m.
Q.2) The following line graph shows the yearly sales figures for a manufacturing company
(a) What were the sales in (i) 2002 (ii) 2006?
(b) What were the sales in (i) 2003 (ii) 2005?
(c) Compute the difference between the sales in 2002 and 2006.
(d) In which year was there the greatest difference between the sales as compared to its previous year?
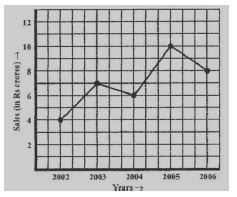
Sol.2) (a) The sales in:
(i) 2002 was Rs.4 crores and
(ii) 2006 was Rs.8 crores.
(b) The sales in:
(i) 2003 was Rs. 7 crores and
(ii) 2005 was Rs.10 crores.
(c) The difference of sales in 2002 and 2006 = Rs.8 crores – Rs.4 crores = Rs.4 crores
(d) In the year 2005, there was the greatest difference between the sales as compared to its previous year, which is (Rs.10 crores – Rs.6 crores) = Rs.4 crores.
Q.3) For an experiment in Botany, two different plants, plant A and plant B were grown under similar laboratory conditions. Their heights were measured at the end of each week for 3 weeks. The results are shown by the following graph.
(a) How high was Plant A after (i) 2 weeks (ii) 3 weeks?
(b) How high was Plant B after (i) 2 weeks (ii) 3 weeks?
(c) How much did Plant A grow during the 3rd week?
(d) How much did Plant B grow from the end of the 2nd week to the end of the 3rd week?
(e) During which week did Plant A grow most?
(f) During which week did Plant B grow least?
(g) Were the two plants of the same height during any week shown here? Specify.
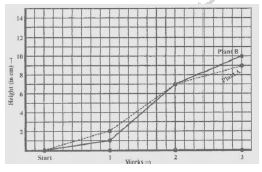
Sol.3) (a) (i) The plant A was 7 cm high after 2 weeks and
(ii) after 3 weeks it was 9 cm high.
(b) (i) Plant B was also 7 cm high after 2 weeks and
(ii) after 3 weeks it was 10 cm high.
(c) Plant A grew = 9 cm – 7 cm = 2 cm during 3rd week.
(d) Plant B grew during end of the 2nd week to the end of the 3rd week = 10 cm – 7 cm = 3 cm.
(e) Plant A grew the highest during second week.
(f) Plant B grew the least during first week.
(g) At the end of the second week, plant A and B were of the same height.
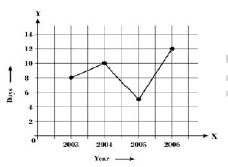
Q.4) The following graph shows the temperature forecast and the actual temperature for each day of a week.
(a) On which days was the forecast temperature the same as the actual temperature?
(b) What was the maximum forecast temperature during the week?
(c) What was the minimum actual temperature during the week?
(d) On which day did the actual temperature differ the most from the forecast temperature?
Sol.4) (a) On Tuesday, Friday and Sunday, the forecast temperature was same as the actual temperature.
(b) The maximum forecast temperature was 35o C.
(c) The minimum actual temperature was 15o C.
(d) The actual temperature differed the most from the forecast temperature on Thursday.
Q.5) Use the tables below to draw linear graphs.
(a) The number of days a hill side city received snow in different years.

Sol.5) (a) The graph for given data is as shown below:
Here, x-axis represents the number of years and scale taken is 2 unit = 1 year, whereas y-axis represents number of days and scale taken is 1 unit = 2 days.
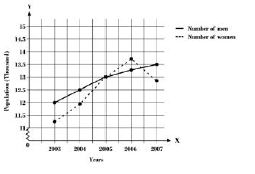
(b) The graph for given data is as shown below:
Here, x-axis represents the number of years and scale taken is 2 unit = 1 year, whereas y-axis represents population and scale taken is 1 unit = 0.5 thousand.
Q.6) A courier-person cycles from a town to a neighbouring suburban area to deliver a parcel to a merchant. His distance from the town at different times is shown by the following graph.
(a) What is the scale taken for the time axis?
(b) How much time did the person take for the travel?
(c) How far is the place of the merchant from the town?
(d) Did the person stop on his way? Explain.
(e) During which period did he ride fastest?
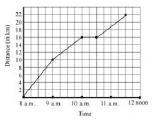
Sol.6) (a) 4 units = 1 hour.
(b) The person took 3(1/2) hours for the travel.
(c) It was 22 km far from the town.
(d) Yes, this has been indicated by the horizontal part of the graph. He stayed from 10 am to
10.30 am.
(e) He rode the fastest between 8 am and 9 am.
Q.7) Can there be a time-temperature graph as follows? Justify your answer.
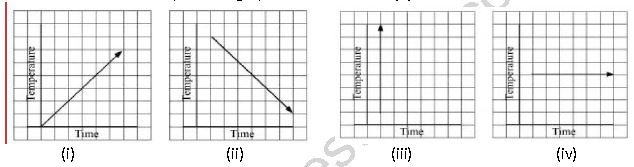
Sol.7) (i) It is showing the increase in temperature.
(ii) It is showing the decrease in temperature.
(iii) The graph figure
(iii) is not possible since temperature is increasing very rapidly which is not possible.
(iv) It is showing constant temperature.
Exercise 15.2
Q.1) Plot the following points on a graph sheet. Verify if they lie on a line
(a) A(4, 0), B(4, 2), C(4, 6), D(4, 2.5)
(b) P(1, 1), Q(2, 2), R(3, 3), S(4, 4)
(c) K(2, 3), L(5, 3), M(5, 5), N(2, 5)
Sol.1)
(a) All points A, B, C and D lie on a vertical line.
(b) P, Q, R and S points also make a line. It verifies that these points lie on a line.
(c) These points do not lie in a straight line.
Q.2) Draw the line passing through (2, 3) and (3, 2). Find the coordinates of the points at which this line meets the x-axis and y-axis.
Sol.2)
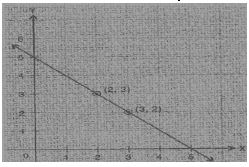
The coordinates of the points at which this line meets the x - axis at (5, 0) and y -axis at (0, 5).
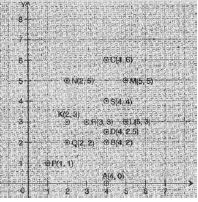
Q.3) Write the coordinates of the vertices of each of these adjoining figures.
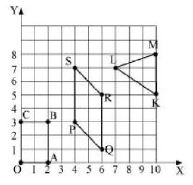
Sol.3) Vertices of figure OABC
O (0, 0), A (2, 0), B (2, 3) and C (0, 3)
Vertices of figure PQRS
P (4, 3), Q (6, 1), R (6, 5) and S (4, 7)
Vertices of figure LMK
L (7, 7), M (10, 8) and K (10, 5)
Q.4) State whether True or False. Correct that are false.
(i) A point whose x coordinate is zero and y-coordinate is non-zero will lie on the yaxis.
(ii) A point whose y coordinate is zero and x-coordinate is 5 will lie on y-axis.
(iii) The coordinates of the origin are (0, 0).
Sol.4) (i) True (ii) False, it will lie on x - axis. (iii) True
Exercise 15.3
Q.1) Draw the graphs for the following tables of values, with suitable scales on the axes.
(a) Cost of apples
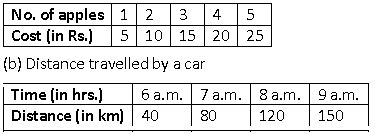
i) How much distance did the car cover during the period 7.30 a.m. to 8 a.m?
(ii) What was the time when the car had covered a distance of 100 km since it’s start?
(c) Interest on deposits for a year.
![]()
(i) Does the graph pass through the origin?
(ii) Use the graph to find the interest on Rs. 2500 for a year.
(iii) To get an interest of Rs.280 per year, how much money should be deposited?
Sol.1)

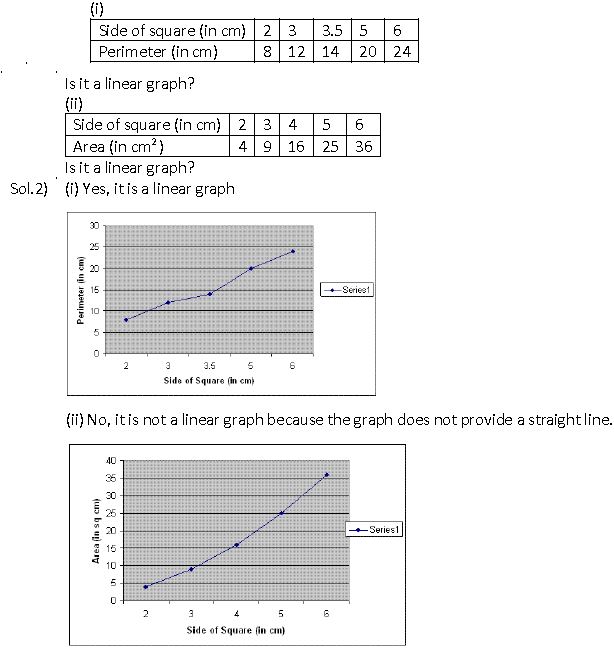
Q.2) Draw a graph for the following.
Free study material for Mathematics
NCERT Solutions Class 8 Mathematics Chapter 15 Introduction To Graphs
Students can now access the NCERT Solutions for Chapter 15 Introduction To Graphs prepared by teachers on our website. These solutions cover all questions in exercise in your Class 8 Mathematics textbook. Each answer is updated based on the current academic session as per the latest NCERT syllabus.
Detailed Explanations for Chapter 15 Introduction To Graphs
Our expert teachers have provided step-by-step explanations for all the difficult questions in the Class 8 Mathematics chapter. Along with the final answers, we have also explained the concept behind it to help you build stronger understanding of each topic. This will be really helpful for Class 8 students who want to understand both theoretical and practical questions. By studying these NCERT Questions and Answers your basic concepts will improve a lot.
Benefits of using Mathematics Class 8 Solved Papers
Using our Mathematics solutions regularly students will be able to improve their logical thinking and problem-solving speed. These Class 8 solutions are a guide for self-study and homework assistance. Along with the chapter-wise solutions, you should also refer to our Revision Notes and Sample Papers for Chapter 15 Introduction To Graphs to get a complete preparation experience.
FAQs
The complete and updated is available for free on StudiesToday.com. These solutions for Class 8 Mathematics are as per latest NCERT curriculum.
Yes, our experts have revised the as per 2026 exam pattern. All textbook exercises have been solved and have added explanation about how the Mathematics concepts are applied in case-study and assertion-reasoning questions.
Toppers recommend using NCERT language because NCERT marking schemes are strictly based on textbook definitions. Our will help students to get full marks in the theory paper.
Yes, we provide bilingual support for Class 8 Mathematics. You can access in both English and Hindi medium.
Yes, you can download the entire in printable PDF format for offline study on any device.