
Get the most accurate NCERT Solutions for Class 8 Mathematics Chapter 5 Data Handling here. Updated for the 2026-27 academic session, these solutions are based on the latest NCERT textbooks for Class 8 Mathematics. Our expert-created answers for Class 8 Mathematics are available for free download in PDF format.
Detailed Chapter 5 Data Handling NCERT Solutions for Class 8 Mathematics
For Class 8 students, solving NCERT textbook questions is the most effective way to build a strong conceptual foundation. Our Class 8 Mathematics solutions follow a detailed, step-by-step approach to ensure you understand the logic behind every answer. Practicing these Chapter 5 Data Handling solutions will improve your exam performance.
Class 8 Mathematics Chapter 5 Data Handling NCERT Solutions PDF
Exercise 5.1
Q.1) Q.1. For which of these would you use a histogram to show the data?
(a) The number of letters for different areas in a postman’s bag.
(b) The height of competitors in an athletics meet.
(c) The number of cassettes produced by 5 companies.
(d) The number of passengers boarding trains from 7:00 a.m. to 7:00 p.m. at a station.
Give reasons for each.
Sol.1) Since, Histogram is a graphical representation of data, if data represented in manner of class-interval.
Therefore, for case (b) and (d), we would use a histogram to show the data, because in these cases, data can be divided into class-intervals.
In case (b), a group of competitions having different heights in an athletics meet.
In case (d), the number of passengers boarding trains in an interval of one hour at a station.
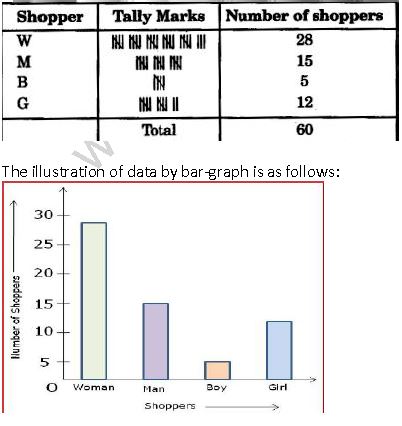
Q.2) The shoppers who come to a departmental store are marked as: man (M), woman (W), boy (B) or girl (G). The following list gives the shoppers who came during the first hour in the morning.
W W W G B W W M G G M M W W W W G B M W B G G M W W M M W W W M W B W G
M W W W W G W M M W M W G W M G W M M B G G W.
Make a frequency distribution table using tally marks. Draw a bar graph to illustrate it.
Sol.2) The frequency distribution table is as follows:
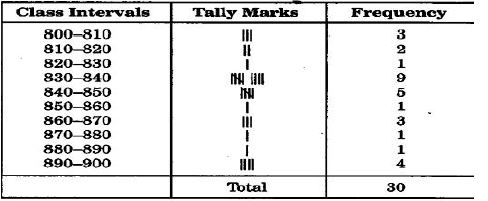
Q.3) The weekly wages (in Rs) of 30 workers in a factory are:
830, 835, 890, 810, 835, 836, 869, 845, 898, 890, 820, 860, 832, 833, 855, 845, 804, 808,
812, 840, 885, 835, 835, 836, 878, 840, 868, 890, 806, 840
Using tally marks make a frequency table with intervals as 800–810, 810–820 and so on.
Sol.3) The representation of data by frequency distribution table using tally marks is as follows:
Q.4) Draw a histogram for the frequency table made for the data in Question 3 and answer the following questions.
(i) Which group has the maximum number of workers?
(ii) How many workers earn Rs.850 and more?
(iii) How many workers earn less than Rs. 850?
Sol.4) (i) 830 – 840 group has the maximum number of workers.
(ii) 10 workers can earn more than Rs.850.
(iii) 20 workers earn less than Rs.850.

Q.5) The number of hours for which students of a particular class watched television during holidays is shown through the given graph. Answer the following:
(i) For how many hours did the maximum number of student’s watch T.V.?
(ii) How many students watched TV for less than 4 hours?
(iii) How many students spent more than 5 hours in watching TV?
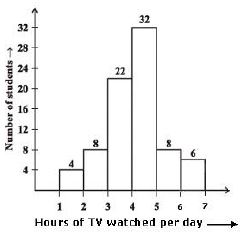
Sol.5) (i) The maximum number of students watched T.V. for 4 – 5 hours.
(ii) 34 students watched T.V. for less than 4 hours.
(iii) 14 students spent more than 5 hours in watching T.V.
Exercise 5.2
Q.1) A survey was made to find the type of music that a certain group of young people liked in a city. Adjoining pie chart shows the findings of this survey. From this pie chart answer the following:
(i) If 20 people liked classical music, how many young people were surveyed?
(ii) Which type of music is liked by the maximum number of people?
(iii) If a cassette company were to make 1000 CD’s, how many of each type would they make?

Sol.1) (i) 10% represents 100 people.
Therefore 20% represents
100×20/10 = 200 𝑝𝑒𝑜𝑝𝑙𝑒
Hence, 200 people were surveyed.
ii) Light music is liked by the maximum number of people
iii) CD’s of classical music = 10×1000/100 = 100
iv) CD’s of semi-classical music = 20×1000/100 = 200
CD’s of light music = 40×1000/100 = 400
CD’s of folk music = 30×1000/100 = 300
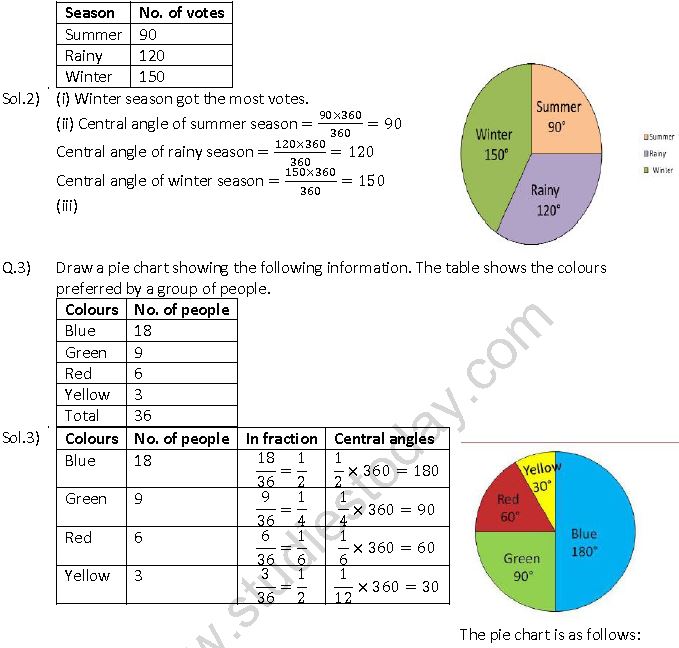
Q.2) A group of 360 people were asked to vote for their favourite season from the three seasons rainy, winter and summer.
(i) Which season got the most votes?
(ii) Find the central angle of each sector.
(iii) Draw a pie chart to show this information
Q.4) The adjoining pie chart gives the marks scored in an examination by a student in Hindi, English, Mathematics, Social Science and Science. If the total marks obtained by the students were 540, answer the following questions:
(i) In which subject did the student score 105 marks?
(Hint: for 540 marks, the central angle = 360 . So, for 105 marks, what is the central angle?)
(ii) How many more marks were obtained by the student in Mathematics than in Hindi?
(iii) Examine whether the sum of the marks obtained in Social Science and Mathematics is more than that in Science and Hindi. (Hint: Just study the central angles)
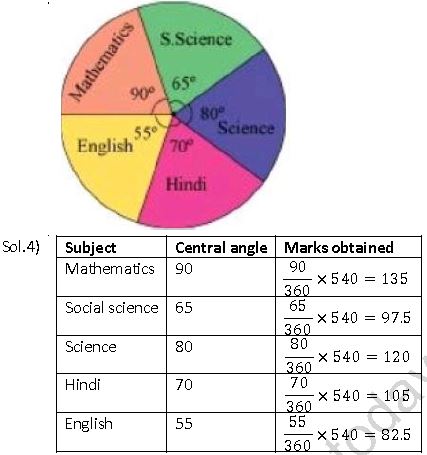
(i) The student scored 105 marks in Hindi.
(ii) Marks obtained in Mathematics = 135
Marks obtained in Hindi = 105
Difference = 135 – 105 = 30
Thus, 30 more marks were obtained by the student in Mathematics than in Hindi.
(iii) The sum of marks in Social Science and Mathematics = 97.5 + 135 = 232.5
The sum of marks in Science and Hindi = 120 + 105 = 225 Yes, the sum of the marks in Social Science and Mathematics is more than that in Science and Hindi.
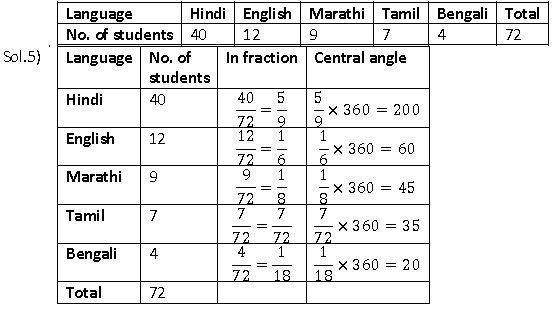
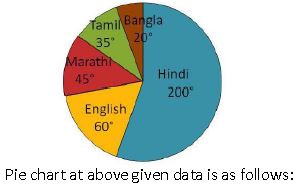
Q.5) The number of students in a hostel, speaking different languages is given below. Display the data in a pie chart.
Exercise 5.3
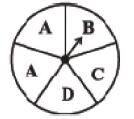
Q.1) List the outcomes you can see in these experiments.
(a) Spinning a wheel (b) Tossing two coins together
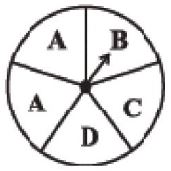
Sol.1) (a) There are four letters A, B, C and D in a spinning wheel. So there are 4 outcomes.
(b) When two coins are tossed together.
There are four possible outcomes HH, HT, TH, TT.
(Here HT means head on first coin and tail on second coin and so on.)
Q.2) When a die is thrown, list the outcomes of an event of getting:
(i) (a) a prime number (b) not a prime number
(ii) (a) a number greater than 5 (b) a number not greater than 5
Sol.2) (i)
(a) Outcomes of event of getting a prime number are 2, 3 and 5.
(b) Outcomes of event of not getting a prime number are 1, 4 and 6.
(ii)
(a) Outcomes of event of getting a number greater than 5 is 6.
(b) Outcomes of event of not getting a number greater than 5 are 1, 2, 3, 4 and 5.
Q.3) Find the:
(a) Probability of the pointer stopping on D in (Question 1 (a)).
(b) Probability of getting an ace from a well shuffled deck of 52 playing cards.
(c) Probability of getting a red apple. (See figure below)
Sol.3) (a) In a spinning wheel, there are five pointers A, A, B, C, D. So there are five outcomes. Pointer stops at D which is one outcome.
So the probability of the pointer stopping on D = 1/5 .
(b) There are 4 aces in a deck of 52 playing cards. So, there are four events of getting an ace.
So, probability of getting an ace = 4/42 = 1/4
(c) Total number of apples = 7
Number of red apples = 4
Probability of getting red apple = 4/7.
Q.4) Numbers 1 to 10 are written on ten separate slips (one number on one slip), kept in a box and mixed well.
One slip is chosen from the box without looking into it. What is the probability of:
(i) getting a number 6.
(ii) getting a number less than 6.
(iii) getting a number greater than 6.
(iv) getting a 1-digit number.
Sol.4) (i) Outcome of getting a number 6 from ten separate slips is one.
Therefore, probability of getting a number 6 = 1/10
(ii) Numbers less than 6 are 1, 2, 3, 4 and 5 which are five. So there are 5 outcomes.
Therefore, probability of getting a number less than 6 = 5/10 = 1/2
(iii) Number greater than 6 out of ten that are 7, 8, 9, 10. So there are 4 possible outcomes. Therefore, probability of getting a number greater than 6 = 4/10 = 2/5
(iv) One digit numbers are 1, 2, 3, 4, 5, 6, 7, 8, 9 out of ten.
Therefore, probability of getting a 1-digit number = 9/10
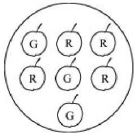
Q.5) If you have a spinning wheel with 3 green sectors, 1 blue sector and 1 red sector, what is the probability of getting a green sector? What is the probability of getting a none-blue sector?
Sol.5) There are five sectors. Three sectors are green out of five sectors.
Therefore, probability of getting a green sector = 3/5
There is one blue sector out of five sectors.
Non-blue sectors = 5 – 1 = 4 sectors
Therefore, probability of getting a non-blue sector = 4/5
Q.6) Find the probability of the events given in Question 2.
Sol.6) When a die is thrown, there are total six outcomes, i.e., 1, 2, 3, 4, 5 and 6.
(i)
(a) 2, 3, 5 are prime numbers. So there are 3 outcomes out of 6.
Therefore, probability of getting a prime number = 3/6 = 1/2
(b) 1, 4, 6 are not the prime numbers. So there are 3 outcomes out of 6.
Therefore, probability of getting a prime number = 3/6 = 1/2
(ii)
(a) Only 6 is greater than 5. So there is one outcome out of 6. Therefore, probability of getting a number greater than 5 = 1/6
(b) Numbers not greater than 5 are 1, 2, 3, 4 and 5. So there are 5 outcomes out of 6.
Therefore, probability of not getting a number greater than 5 = 5/6.
Free study material for Mathematics
NCERT Solutions Class 8 Mathematics Chapter 5 Data Handling
Students can now access the NCERT Solutions for Chapter 5 Data Handling prepared by teachers on our website. These solutions cover all questions in exercise in your Class 8 Mathematics textbook. Each answer is updated based on the current academic session as per the latest NCERT syllabus.
Detailed Explanations for Chapter 5 Data Handling
Our expert teachers have provided step-by-step explanations for all the difficult questions in the Class 8 Mathematics chapter. Along with the final answers, we have also explained the concept behind it to help you build stronger understanding of each topic. This will be really helpful for Class 8 students who want to understand both theoretical and practical questions. By studying these NCERT Questions and Answers your basic concepts will improve a lot.
Benefits of using Mathematics Class 8 Solved Papers
Using our Mathematics solutions regularly students will be able to improve their logical thinking and problem-solving speed. These Class 8 solutions are a guide for self-study and homework assistance. Along with the chapter-wise solutions, you should also refer to our Revision Notes and Sample Papers for Chapter 5 Data Handling to get a complete preparation experience.
FAQs
The complete and updated is available for free on StudiesToday.com. These solutions for Class 8 Mathematics are as per latest NCERT curriculum.
Yes, our experts have revised the as per 2026 exam pattern. All textbook exercises have been solved and have added explanation about how the Mathematics concepts are applied in case-study and assertion-reasoning questions.
Toppers recommend using NCERT language because NCERT marking schemes are strictly based on textbook definitions. Our will help students to get full marks in the theory paper.
Yes, we provide bilingual support for Class 8 Mathematics. You can access in both English and Hindi medium.
Yes, you can download the entire in printable PDF format for offline study on any device.