

Download Class 7 Mathematics Practice Worksheets
Access comprehensive chapter-wise worksheets for Chapter 03 Data Handling using the CBSE Class 7 Mathematics Data Handling Worksheet Set 01. Designed to align with the 2026-27 academic syllabus for Class 7 Mathematics, these printable practice sets help students reinforce key concepts and improve their overall exam readiness.
Access Chapter 03 Data Handling Practice Papers and Solutions
Navigate directly to the solved Mathematics worksheets using the digital viewer below. Each practice set includes detailed step-by-step solutions, allowing students to instantly cross-check their work and identify areas requiring further revision.
Question. Find mean of the first seven whole numbers.
Answer : 5
Question. The mean of 8, 4, 5, x and 10 is 8. Find the value of x.
Answer : 13
Question. The marks scored by a student in five subjects are 80, 75, 66, 51 and 91. How much should he score in the 6th subject to make his average score 75?
Answer : 84
Question. Calculate the mean : 7.6, 4.8, 8.5, 6.4, 5.6, 3.5, 7.2, 4.4.
Answer : 6
Question. Find mean of the first six natural numbers.
Answer : 3.5
Question. Find the median of the data : 41, 43, 46, 48, 49, 52, 53, 55, 56.
Answer : 49
Question. The age in years of 8 teachers of a school are 41, 28, 54, 35, 26, 33, 40, 39, find the mean.
Answer : 37 years
Question. The mean of 4, 3, x + 3, 9, 10 is 7. Find the value of x.
Answer : 6
Question. The mean of 5 numbers is 28. If one number is excluded, their mean is 26. Find the excluded number.
Answer : 36
Question. What is the range of the following data : 46, 63, 25, 23, 39, 42, 21, 47, 68?
Answer : 47
Question. Find mean of the first six odd numbers.
Answer : 6
Question. Calculate mean of the first five multiples of 3.
Answer : 9
Question. Calculate the mean of 2, 4, 6, 8, 10, 12, 14, 16.
Answer : 9
Question. The ages in years of 9 teachers in a school are : 23, 34, 37, 39, 41, 42, 43, 45, 47. Find the median.
Answer : 41 years
Question. If the probability of winning a game is 0.8, what is the probability of losing it?
Answer : 0.2
Question. A bag contains 5 red balls and 3 white balls. What is the probability that one ball drawn from the bag is white?
Answer : 3/8
Question. Find mean of the first five even numbers.
Answer : 6
Question. Calculate mean of the first five multiples of 5.
Answer : 15
Solve Q. a – g from Bar Graph
The bar graph given below represents the number of students studying in five different schools of a city. Study the bar graph and answer the following questions.
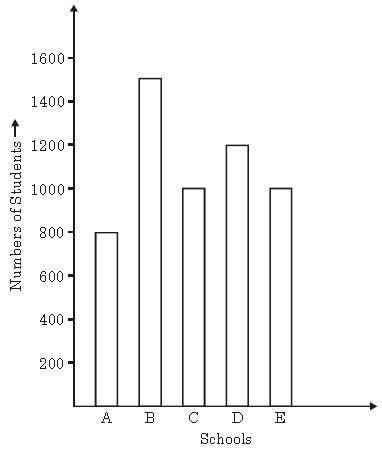
Question a. Which school has the minimum number of students in the above graph and how much?
Answer : A, 800
Question b. What is the sum of the number of students in schools A, C and E?
Answer : 2800
Question c. How many schools are having students less than 1200?
Answer : 3
Question d. Find the ratio of the number of students in schools A and D.
Answer : 2 : 3
Question e. How many total students are there in all the schools?
Answer : 5500
Question f. Which school has the maximum number of students and how much?
Answer : B, 1500
Question g. What is the difference between the number of students in schools B and C?
Answer : 500
Question. What is the new median, when 36 is added to the data : 32, 34, 36, 38, 40, 42, 44?
Answer : 37
Question. A coin is tossed 100 times with the following frequencies :
Head : 49, Tail : 51
When a coin is tossed at random, what is the probability of getting Head?
Answer : 49/100
Question. The marks obtained by 6 students of a class 7th in a test are given below : 12, 15, 23, 23, 19, 21. Find the median.
Answer : 23
Question. Find the range of the given data : 7, 18, 9, 24, 11, 45, 3, 16, 10, 2.
Answer : 43
Question. Find the median : 6, 8, 9, 15, 21, 25, 28, 29.
Answer : 18
Question. What is the value of x if the median of given data is 18 : 15, 16, 17, x + 2, 19, 20, 21?
Answer : 16
Question. If the mean of three observations, x + 2, x + 4, x + 6, is 15. Find x.
Answer : 11
Question. Calculate the mean of first five multiple of 10.
Answer : 30
Question. Find the median of first 7 odd natural numbers.
Answer : 7
Question. The mean of five numbers is 18. If one numbers is excluded, their mean is 16. What is the excluded number?
Answer : 26
Question. The average marks scored by a student in five subjects is 72. Find his total marks.
Answer : 360
vFind the mean of 8, 12, 5, 6, 10, 7.
Answer : 8
Question. What is the mean of first 5 multiples of 2?
Answer : 6
Question. Find mean of the first five prime numbers.
Answer : 5.6
Question. The average runs scored by a cricketer in 6 innings is 55, find his total score.
Answer : 330 runs
Question. What is the class mark of the class 30 – 40?
Answer : 35
Question. What is the lower limit of the class 25 – 35?
Answer : 25
Question. A dice is thrown at random. Find the probability of getting an even number.
Answer : 1/2
Question. First the value of x if the mode of the following data is 7 : 5, 4, 7, 4, 7, x, 7, 4, 3, 5.
Answer : 7
Question. A dice is thrown once. What is the probability of getting 2?
Answer : 1/6
Question. Find the mode of the ages (in years) of 10 students of class VII.
13, 12, 14, 12, 13, 12, 14, 12, 13, 14, 12.
Answer : 12 years
Question. If 23 is taken out from the given data then what is the new median?
20, 21,22, 23, 24, 25, 26, 27
Answer : 24
Question. Find the mode of the following data : 14, 9, 10, 14, 11, 12, 14, 13, 14, 11, 10, 14, 11.
Answer : 14
Question. Find the median from the following data written in ascending order :
29, 41, 45, 63, 67, 69, 70.
Answer : 63
Question. Find the median of first 8 even natural numbers.
Answer : 09
Question 1. Following are the weights ( in kg ) of 8 students of a class
48.5, 50, 44.5, 49.5, 50.5, 45, 51, 43
a) Find the mean weight.
b) What will be the mean weight if a student, whose weight is 62kg, is also included?
Answer: a) Sum of weights = \(48.5 + 50 + 44.5 + 49.5 + 50.5 + 45 + 51 + 43 = 382\)
Number of students = 8
Mean weight = \(\frac{382}{8} = 47.75\) kg
b) New sum of weights including the new student = \(382 + 62 = 444\)
New total number of students = \(8 + 1 = 9\)
New mean weight = \(\frac{444}{9} = 49.33\) kg
In simple words: The mean is found by dividing the total sum of all weights by the number of students. Adding a heavier student increases the overall mean.
Exam Tip: Always double-check your addition when finding the sum of decimal numbers before dividing by the count.
Question 2. Find the arithmetic mean of the scores
8, 6, 10, 12, 1, 3, 4, 4. Find the range of the data.
Answer: Sum of scores = \(8 + 6 + 10 + 12 + 1 + 3 + 4 + 4 = 48\)
Number of scores = 8
Arithmetic mean = \(\frac{48}{8} = 6\)
To find the range, arrange the scores in ascending order: 1, 3, 4, 4, 6, 8, 10, 12
Highest value = 12
Lowest value = 1
Range = \(12 - 1 = 11\)
In simple words: The mean is the average score, and the range is the difference between the highest and lowest scores in the dataset.
Exam Tip: Range is always calculated as Highest value minus Lowest value, not the other way around.
Question 3. Find the mean of the 1st three composite numbers.
Answer: Composite numbers are natural numbers greater than 1 that have more than two positive divisors.
The first three composite numbers are 4, 6, and 8.
Sum = \(4 + 6 + 8 = 18\)
Mean = \(\frac{18}{3} = 6\)
In simple words: Identify the first three numbers with more than two factors (4, 6, and 8) and calculate their average.
Exam Tip: Remember that 1 is neither prime nor composite, and 2, 3, 5 are prime numbers.
Question 4. The heights of 10 girls were measured in cm and the results were as follows.
143, 148, 135, 150, 128, 139, 149, 146, 151, 132
a) What is the height of the tallest girl?
b) What is the height of the shortest girl?
c) What is the range of the data?
d) Find the mean height ?
e) Find the number of girls whose heights are less than the mean height ?
Answer: Arranging the heights in ascending order: 128, 132, 135, 139, 143, 146, 148, 149, 150, 151
a) Height of the tallest girl = 151 cm
b) Height of the shortest girl = 128 cm
c) Range = \(151 - 128 = 23\) cm
d) Sum of heights = \(128 + 132 + 135 + 139 + 143 + 146 + 148 + 149 + 150 + 151 = 1421\)
Mean height = \(\frac{1421}{10} = 142.1\) cm
e) Heights less than 142.1 cm are: 128, 132, 135, 139
Number of girls whose heights are less than the mean height = 4
In simple words: Sorting data makes it easy to find maximums, minimums, ranges, and compare values against the mean.
Exam Tip: Sorting raw data in ascending order before answering sub-questions prevents counting or reading errors.
Question 5. Find the mean of the 1st ten natural numbers.
Answer: The first ten natural numbers are 1, 2, 3, 4, 5, 6, 7, 8, 9, 10.
Sum = \(1 + 2 + 3 + 4 + 5 + 6 + 7 + 8 + 9 + 10 = 55\)
Mean = \(\frac{55}{10} = 5.5\)
In simple words: Add numbers from 1 to 10 and divide by 10 to find the average.
Exam Tip: You can use the sum formula for natural numbers \(\frac{n(n+1)}{2}\) where \(n = 10\) to get 55 quickly.
Question 6. Two different states of India's experts of garments in the years 2000 to 2005 are given in the following table
| Year | 2000 | 2001 | 2002 | 2003 | 2004 | 2005 |
|---|---|---|---|---|---|---|
| Kerala (in crores of Rs) | 5 | 6 | 8 | 10 | 12 | 14 |
| Karnataka (in crores of Rs) | 10 | 11 | 9 | 12 | 8 | 13 |
(i) Draw a double bar graph to represent the data
(ii) What are the total earnings in the years 2002 and 2004 both the states separately?
Answer:
(i) Construction steps for double bar graph:
1. Draw horizontal X-axis representing the years (2000 to 2005) and vertical Y-axis representing earnings in crores of Rs.
2. Choose a suitable scale on the Y-axis: 1 cm = 2 crores of Rs.
3. For each year, draw two side-by-side bars representing Kerala and Karnataka using different shading or colors.
(ii) Total earnings for both states separately:
Year 2002: Kerala = Rs. 8 crores, Karnataka = Rs. 9 crores
Year 2004: Kerala = Rs. 12 crores, Karnataka = Rs. 8 crores
In simple words: A double bar graph compares two sets of data side-by-side for easy visual analysis.
Exam Tip: Always include a clear legend indicating which color represents which category in a double bar graph.
Question 7. Find the mode, mean and median of the scores
4, 5, 6, 7, 7, 8, 9, 13, 12, 8, 8, 9, 8, 10, 11
Answer: First, arrange the 15 scores in ascending order:
4, 5, 6, 7, 7, 8, 8, 8, 8, 9, 9, 10, 11, 12, 13
Number of scores \(n = 15\)
- Mode: The score that occurs most frequently is 8 (appears 4 times). So, Mode = 8.
- Mean: Sum of scores = \(4 + 5 + 6 + 7 + 7 + 8 + 8 + 8 + 8 + 9 + 9 + 10 + 11 + 12 + 13 = 125\)
Mean = \(\frac{125}{15} = \frac{25}{3} = 8.33\)
- Median: The middle value of 15 ordered observations is the \(\frac{15+1}{2} = 8\)th term.
8th term in the sorted list is 8. So, Median = 8.
In simple words: Mode is the most common value, median is the exact middle value when sorted, and mean is the arithmetic average.
Exam Tip: Always sort data before finding the median; missing even one number in counting affects the middle position.
Question 8. Marks obtained by two girls of VII A in final term exam (out of 100) as follows :
| Subjects | English | Hindi | Mathematics | Science | Social |
|---|---|---|---|---|---|
| Sunita | 75 | 80 | 92 | 84 | 62 |
| Vandhana | 72 | 84 | 92 | 65 | 70 |
1) Draw a double bar graph to represent the following data.
2) Who did better in the examination
Answer:
1) Double bar graph construction steps:
- Use subjects on the X-axis and marks (0 to 100) on the Y-axis.
- Scale: 1 cm = 10 marks.
- Draw side-by-side bars for Sunita and Vandhana for each subject.
2) To determine who did better, calculate total marks for each:
Sunita's total marks = \(75 + 80 + 92 + 84 + 62 = 393\)
Vandhana's total marks = \(72 + 84 + 92 + 65 + 70 = 383\)
Sunita's average = \(\frac{393}{5} = 78.6\)
Vandhana's average = \(\frac{383}{5} = 76.6\)
Sunita did better in the examination as her total and average marks are higher.
In simple words: Sunita scored higher overall across all subjects combined.
Exam Tip: When comparing performance across multiple subjects, always compute total marks or overall averages.
Question 9. The number of hours of television programme watched on Sunday in 40 houses were as follows
9, 5, 4, 3, 4, 4, 9, 9, 8, 9
9, 5, 10, 9, 10, 10, 10, 4, 9, 6
7, 9, 5, 9, 9, 8, 6, 7, 9, 6
6, 5, 9, 9, 8, 7, 8, 10, 10, 9
1) Organise the following numbers in a tabular form.
2) Estimate the mean, median and mode of this distribution.
3) What is the range of the data?
Answer:
1) Tabular form using tally marks:
| Hours of TV | Tally Marks | Frequency |
|---|---|---|
| 3 | | | 1 |
| 4 | |||| | 4 |
| 5 | |||| | 4 |
| 6 | |||| | 4 |
| 7 | ||| | 3 |
| 8 | |||| | 5 |
| 9 | HH HH | | 11 |
| 10 | HH || | 7 |
| Total | - | 40 |
2) Calculations:
Sum of all hours = \((3 \times 1) + (4 \times 4) + (5 \times 4) + (6 \times 4) + (7 \times 3) + (8 \times 5) + (9 \times 11) + (10 \times 7)\)
\(= 3 + 16 + 20 + 24 + 21 + 40 + 99 + 70 = 293\)
Mean = \(\frac{293}{40} = 7.325\) hours
Median: Middle position for 40 observations is average of 20th and 21st observations.
Looking at cumulative frequencies, 20th and 21st values both fall in 8 hours. So, Median = 8 hours.
Mode: The value with highest frequency (11) is 9. So, Mode = 9 hours.
3) Range = Maximum value - Minimum value = \(10 - 3 = 7\) hours.
In simple words: Frequency distribution tables make calculating statistical measures for large datasets much simpler.
Exam Tip: Always verify that the sum of all frequencies equals the total number of observations (40).
Question 10. A bag contains 3 red and 2 blue marbles. A marble is drawn at random. What is the probability of drawing a blue marble.
Answer: Number of red marbles = 3
Number of blue marbles = 2
Total number of marbles = \(3 + 2 = 5\)
Number of favorable outcomes (blue marbles) = 2
Probability of drawing a blue marble = \(\frac{\text{Number of favorable outcomes}}{\text{Total number of outcomes}} = \frac{2}{5}\)
In simple words: Probability is the ratio of the number of target items to the total number of items.
Exam Tip: Always state the formula for probability before substituting the numbers.
Question 11. A box of 600 electric bulbs contains 12 defective bulbs. One bulb is taken out at random from this box. What is the probability that it is a non defective bulb ?
Answer: Total number of bulbs = 600
Number of defective bulbs = 12
Number of non-defective bulbs = \(600 - 12 = 588\)
Probability of drawing a non-defective bulb = \(\frac{588}{600} = \frac{49}{50} = 0.98\)
In simple words: Subtract defective bulbs from the total to find non-defective ones, then divide by the total.
Exam Tip: Always reduce fractions to their simplest form unless specified otherwise.
Question 12. What is the probability of getting
(i) an even number
(ii) a multiple of 3
(iii) a number 3 or 4
(iv) an odd number
(v) a number between 3 and 6
Answer: Assuming standard outcomes from a single die or set of numbers from 1 to 6 (standard sample space S = {1, 2, 3, 4, 5, 6}, total outcomes = 6):
(i) Even numbers = {2, 4, 6} (3 outcomes)
Probability = \(\frac{3}{6} = \frac{1}{2}\)
(ii) Multiples of 3 = {3, 6} (2 outcomes)
Probability = \(\frac{2}{6} = \frac{1}{3}\)
(iii) Number 3 or 4 = {3, 4} (2 outcomes)
Probability = \(\frac{2}{6} = \frac{1}{3}\)
(iv) Odd numbers = {1, 3, 5} (3 outcomes)
Probability = \(\frac{3}{6} = \frac{1}{2}\)
(v) Number between 3 and 6 = {4, 5} (2 outcomes)
Probability = \(\frac{2}{6} = \frac{1}{3}\)
In simple words: Count how many numbers match the condition and divide by 6.
Exam Tip: Clearly write down the favorable outcomes set before calculating the probability fraction.
(i) An adventure group of 25 people undertook a trek. The following are the times (in min.) taken by them. 50, 42, 65, 54, 48, 75, 42, 38, 50, 46, 55, 68, 70, 45, 78, 50, 63, 40, 68, 50, 72, 60, 65, 50, 48.
The organizers of the trek wanted the refreshment to be ready after 50% of the trekkers had reached the end point. What measure of central tendency should they use? Find the value of that measure.
(ii) What was the time taken by maximum number of people? What measure of central tendency tells you this? Find its value.
(iii) The organizers also wanted to know the average time taken by the group to complete the trek. What measure of central tendency will tell them this? Find its value.
2. Following data gives the number of children in 40 families: 1,2,6,5,1,5,1,3,2,6,2,3,4,2,0,0,4,4,3,2,2,0,0,1,2,2,4,3,2,1,0,5,1,2,4,3,4,1,6,2. Represent it in the form of a frequency distribution table.
1) Subtract (-24 ) from the sum of 38 and (- 83).
2) The sum of two integers is (-18). If one of them is 53, find the other.
3) Solve:
a.) (-125) X (-9)
b.) (108) ÷ (-12)
4) Find the value using distributive property:
a.) (-3989) X 8 + 3989 X (-92)
b.) (-700) X 49 + (-700)
5) Verify the property a X (b+c) = a X b + a X c
a = (-3), b = 7, c = (-9)
6) What will be the sign of the resultant integer, if we multiply 5 negative integers and 2 positive integers?
7) Tanya entered the lift on the 20th floor and got out of the lift on 7th floor. How many floors did she travel downwards?
8) The maximum daily temperatures ( in ˚C) for the first week of a month in Delhi are 37, 35, 38, 34, 39, 33, 33. Calculate the range and median temperature of the week.
9) The runs scored by Sachin Tendulkar in 7 one day international matches are 99, 66, 102, 72, 48, 89 and 62 respectively. Find his mean score.
10) Draw a bar graph to compare the various activities taken up by boys and girls of class VII in school.
| ACTIVITIES | ART | MUSIC | DANCE | YOGA | DRAMATICS |
| BOYS | 10 | 40 | 25 | 20 | 15 |
| GIRLS | 15 | 30 | 35 | 20 | 25 |
a.) How many boys and girls are there in all the activities?
b.) Who exceeds in participation of activities – boys or girls?
11) There are four flash cards – one red, one green and two blue. What is the
probability of drawing a blue card?
12) In a bag there are seven cards numbered 1 to 7. A card is picked at random. What
is the probability of picking:
a.) A prime number.
b.) An odd number.
c.) 0.
13) To know about the liking of science as a subject, a survey of 200 students was
conducted and data obtained is given below:
Liking – 125; Disliking—75.
Find the probability that a student chosen at random,
a.) Does not like science as a subject.
b.) Likes science as a subject.
14) Find the value:
a.) 2(1/3) + 3(1/2) - 1(1/6)
b.) 11/12 - 6/18
15) Each side of a square is 5(2/3)m. Find the area of the square.
16) A teacher takes 6 periods in a day. The duration of each period is 2/3 hours. What is
the total duration of 6 periods?
17) The product of two fractions is 13(1/4). If one of them is 5(3/4), find the other fraction.
18) A roll of cloth measures 60m. If 2(1/2) m of cloth are required to stitch a shirt, how
many shirts can be stitched using this roll of cloth?
19) By how much should 32.67 be increased to get 60.1?
20) The cost of 15.5 litres of milk is Rs 395.25. Find the cost of 1 litre of milk. Also find
the cost of 30 litres of milk.
21) By what number should be divided to get 5?
22) 31/41, when multiplied by ‘x’ gives the product as 1. Which fraction does x represent?
PROJECT
1.) Click 15 photographs from your surroundings that are symmetrical and draw their
lines of symmetry.
2.) Make a wind chime using different solid shapes.
Free study material for Mathematics
Chapter 03 Data Handling Printable Worksheets and Exercises for Class 7 Mathematics
Daily Practice Questions for Class 7 Mathematics
Explore reliable practice questions for Chapter 03 Data Handling tailored for Class 7 Mathematics learners. Use these structured worksheets to evaluate exam preparedness and strengthen problem-solving skills throughout the 2026 academic session.
Detailed Answers for Class 7 Mathematics Chapter 03 Data Handling
Each worksheet draws directly from authorized standard textbooks to maintain academic accuracy. Evaluating your finished exercises against expert-verified solutions helps master the formal presentation standards expected in school evaluations.
Complete Your Chapter Revision
Follow up your worksheet practice by attempting the interactive online MCQ tests for Chapter 03 Data Handling to evaluate your execution speed. All printable assignments and revision sheets on our platform are updated for the 2026 session and available free of charge.
FAQs
You can download the latest chapter-wise printable worksheets for Class 7 Mathematics Chapter 03 Data Handling for free from StudiesToday.com. These have been made as per the latest CBSE curriculum for this academic year.
Yes, Class 7 Mathematics worksheets for Chapter 03 Data Handling focus on activity-based learning and also competency-style questions. This helps students to apply theoretical knowledge to practical scenarios.
Yes, we have provided solved worksheets for Class 7 Mathematics Chapter 03 Data Handling to help students verify their answers instantly.
Yes, our Class 7 Mathematics test sheets are mobile-friendly PDFs and can be printed by teachers for classroom.
For Chapter 03 Data Handling, regular practice with our worksheets will improve question-handling speed and help students understand all technical terms and diagrams.