
Access the latest CBSE Class 9 Social Science Poverty As A Challenge Resource Worksheet. We have provided free printable Class 9 Social Science worksheets in PDF format, specifically designed for Economics Chapter 3 Poverty as a Challenge. These practice sets are prepared by expert teachers following the 2025-26 syllabus and exam patterns issued by CBSE, NCERT, and KVS.
Economics Chapter 3 Poverty as a Challenge Social Science Practice Worksheet for Class 9
Students should use these Class 9 Social Science chapter-wise worksheets for daily practice to improve their conceptual understanding. This detailed test papers include important questions and solutions for Economics Chapter 3 Poverty as a Challenge, to help you prepare for school tests and final examination. Regular practice of these Class 9 Social Science questions will help improve your problem-solving speed and exam accuracy for the 2026 session.
Download Class 9 Social Science Economics Chapter 3 Poverty as a Challenge Worksheet PDF

Question. Why do different countries use different poverty lines?
Answer : Each country uses different poverty lines because different countries’ basic needs vary according to their social and economic situations. Because of the variable cost of living which varies from country to country different countries have different poverty lines. In some countries the income required to live a life which is above poverty line is lower than the income require to live a life which is above poverty line in another country. For example, if we look at America then its basic need is car where the basic need of India is bread, cloth and house. A person will be categorised under the poor in America if she/he doesn’t have a car but in India, car is still considered a luxury item.
Question. What do you think would be the ‘minimum necessary level’ in your locality?
Answer : According to me minimum necessary level in our locality is two thousand rupees per month, because I live in very poor locality. Because of belonging to poor strata, we are unable to earn much and because of low income we are unable to spend more; that’s why the minimum necessary level in our locality is very low. We don’t need much to spend on luxuries or lavishing things because already it’s very difficult task for us to earn for our basic needs.
Question. Study the Table above and answer the following questions:
1. Even if poverty ratio declined between 1993-94 and 2004-05, why did the number of poor remain at about 407 million?
2. Are the dynamics of poverty reduction the same in rural and urban India?
Answer : 1. Even if poverty ratio declined, the number of poor remained at about 407 million because of rapid growth in population. Because of growing population opportunities of employment and supply of food have become a big issue for the government. Besides these two things the fact is that the first and foremost issue for government is to get the basic needs of the individuals fulfilled and till the time every citizen gets the requisite basic amenities, this number is likely to rise.
2. The dynamics of poverty reduction are not the same in rural and urban India because the rural poor and urban poor have to face different issues of poverty. For example landlessness is major issue of poverty in rural areas but in urban areas unemployment is the major issue.
Question. Observe some of the poor families around you and try to find the following:
(i) Which social and economic group do they belong to?
(ii) Who are the earning members in the family?
(iii) What is the condition of the old people in the family?
(iv) Are all the children (boys and girls) attending schools?
Answer : (i) Some of the poor families around us belong to social groups like scheduled tribes and scheduled castes households and economic group like rural agricultural labour household. Few of them belong to other social groups as well.
(ii) Usually each able member of these families earns through some or other activity. This is because the wages earned by one or two members of the family are usually not enough to help sustain the household.
(iii) The older people in these families have the most dilapidated situation. They suffer from medical conditions but don’t get enough medical attention due to lack of resources. They do not get respect in the family as they are considered burdensome for the family.
(iv) Hardly any of the children are attending school. The parents who even send their children to schools, send the male children, while the female children are left at home to manage household chores.
Question. Study the Graph above and do the following:
Poverty Ratio in Selected Indian States, 1999-2000
(i) Identify the three states where the poverty ratio is the highest.
(ii) Identify the three states where poverty ratio is the lowest.
Answer : (i) In states like Orissa, Bihar and Assam, the poverty ratio is the highest because these are the states that have been suffering from underdevelopment, illiteracy and other issues which further deteriorates the bad condition of the poor.
(ii) In states like Kerela, Punjab and Himachal Pradesh in these states the poverty ratio is the lowest because of the economic development in these states. These states have been developed upto a limit from the very beginning and people are educated, they have skills and knowledge which makes it easier for them to be on the favorable side of poverty line.
Question. Study the Graph and do the following: Graph: Number of poor by region ($1 per day) in millions)
1. Identify the areas of world where poverty ratios have declined.
2. Identify the areas of globe which has the largest concentration of the poor.
Answer : 1. In China, East Asia, and South Asia, the poverty ratios have declined. The socio-cultural and economic factors also are responsible for poverty.
2. The Sub-Saharan Africa has the largest concentration of the poor. People living in poverty in this region were 54 percent in 1990, and have decreased meagerly to 41 percent in 2013. This dip is disproportionate to other regions which have shown drastic decline in the percentage of poor over the same period. Exercise
Question. Describe how the poverty line is estimated in India.
Answer : Following are the methods which are used in calculating the poverty line in India:
1. A minimum level of food requirement, foot-wear, fuel and light, clothing, educational and medical requirements etc. are the basic factors on which the basis poverty line is calculated. 2. While estimating the poverty line, the present formula is based on the desired calorie requirement.
3. In the urban area, the accepted average calorie requirement in India is 2100 calories per person per day and in rural areas, the accepted average calorie requirement is 2400 calorie per person per day. The calorie requirement of the people in rural areas is higher than that of the people living in urban areas because they do more physical work as compared to urban people.
Question. Do you think that present methodology of poverty estimation is appropriate?
Answer : No, according to me the present methodology of poverty determination is not appropriate because the present poverty estimation techniques are based on the minimum sustenance standards. The human life is far more valuable and complicated than to be weighed in the light of mere sustenance. So, the appropriation should also take into consideration important human development features like education, job security, health care etc.
Question. Describe poverty trends in India since 1973.
Answer : Poverty trends in India since 1973: After analyzing the above table, it is clear that poverty has been on the downward curve over the last few decades. The percentage of poor has declined drastically from 45 in 1993-94 to 22 in 2011-12. The poverty level calculation methodology has also been revised over these years. The percentage of urban poor has declined faster than that of the rural areas. This can be attributed to the fact that there are more availability of economic activities in urban areas than the rural areas.
Question. Discuss the major reasons for poverty in India.
Answer : 1. Illiteracy: Independent India had very high rates of illiteracy just after independence. This was due to the fact that the Britishers did not spend commensurately on education and rather discouraged educational reforms. Over the years, the literacy rates rose but still as nearly 30 per cent of the Indians are illiterate, they find it difficult to engage in well-paying economic activities and thus remain poor.
2. Unemployment: It is the second major reason for poverty. The people who don’t get work sit idle. Unemployment is basically because of the unavailability of education which plays a vital role in the social as well as economic development of an individual.
3. Inequalities of Incomes: The unequal distribution of income is the other reason for poverty. Money has been rendered in a few people’s hands and then they distribute it. One of the major reasons for this is the unequal distribution of land and other resources. Despite many policies, we have not been able to tackle the issue in a meaningful manner. Land reforms which aimed at the redistribution of assets in rural areas have not been implemented properly.
4. Slow Growth of Employment Opportunities:
There is a slow growth of employment opportunities, especially in industrial sectors. On the other hand, the population is growing day by day leading to the growth of the labour force without sufficient job opportunities. The failure at both the fronts: promotion of economic growth and population control has perpetuated the cycle of poverty.
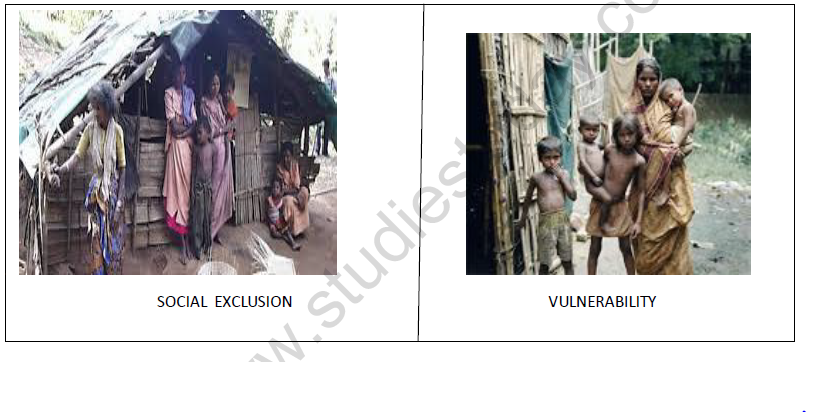
Question. Identify the social and economic groups which are most vulnerable to poverty in India.
Answer : Groups vulnerable to poverty can be divided into two groups:
(a) Social groups vulnerable to poverty
(b) Economic groups vulnerable to poverty.
(a) 29% of scheduled castes are poor and 43% of scheduled tribes are not able to meet their basic needs and come under social groups vulnerable to poverty.
(b) The rural agricultural labour households and the urban casual labour households are the most vulnerable groups among the economic groups vulnerable to poverty.
Question. Give an account of inter-state disparities of poverty in India.
Answer : In India one of the aspects of poverty is inter-state disparities. Every state has different quantities of poor people. Although state level poverty has started to witness a regular decline from the early seventies, the success rate varies from state to state. Following are few facts related to inter-state disparities of poverty.
1. In Kerala, Andhra Pradesh, Gujarat and West Bengal, Tamil Nadu, have shown a significant decline in poverty.
2. In Orissa and Bihar, poverty is still an earnest issue and these states have the highest poverty ratios in the country.
3. The percentage of urban poverty is also very high in the states like Uttar Pradesh and Bihar.
4. The disparity is due to the variable social and political scenarios of different states. 5. The factors like success in population control, availability of resources and tourist destinations has also led to this disparity as all these factors are variable.
Question. Describe global poverty trends.
Answer : Global poverty trends:
1. In developing countries the percentage of poor people is extremely high and still increasing per day.
2. Population living on less than $ 1.99 per day in developing countries has fallen from 35% in 1990 to 10.68% in 2013 according to World Bank.
3. There has been reduction in global poverty, yet it is marked with great regional deviations.
4. Considerably poverty decline has been observed in China and South East Asian countries leading to economic growth and massive investments in human resources development.
5. Poverty has not declined as swiftly in Sub-Saharan Africa. The percentage decline is meagre in the area when compared with the global average and the performance of other areas in the world. 6. The global percentage of poor has declined from 44 percent in 1990 to 17 percent in 2013.
Question. Describe current government strategy of poverty alleviation.
Answer : Current Government strategy of poverty alleviation: To eliminate the poverty many schemes and programmes have been launched by the government. Some of them have been mentioned below:
1. Mahatma Gandhi National Rural Employment Guarantee Act (2005) [MNREGA]: It was launched in 2005 and was implemented in 200 districts on 2nd February, 2006. This scheme provides 100 days assured employment every year to every rural household in 200 districts. If an applicant is not provided employment within 15 days then s/he will be entitled to a daily unemployment allowance.
2. Prime-Minister Rozgar Yojana (PMRY): This programme was started in 1993 which aims at creating self-employment opportunities for educated unemployed youth in rural areas and small towns by helping them set up small business and factories.
3. Swaranjayanti Gram Swarozgar Yojana (SGSY): This was launched in 1999 aiming to bring the assisted poor families who are not below the poverty line by organizing them into self-help groups. In this yojana people below poverty line are not targeted; here the aim of government is to avail self-help groups for people who are above poverty line so that they can improve their conditions and fulfill their other basic requirements.
4. Pradhan Mantri Gramodaya Yojana (PMGY): This was launched in 2000 and aims at improving the standard of living of rural people by developing aspects like health, drinking water, housing, roads and primary education. 5. Antyodaya Anna Yojana (AAY): Its launching year was December 2000. Under this yojana, one crore of the poorest families were identified. Food grains of 25 kilograms were made available to each family at a highly subsidized rate of Rs. 2 per kilogram for wheat and for rice for Rs. 3 per kilogram. The quantity is subject to be improvised to improve the efficacy of the program.
Question. Answer the following questions briefly:
(i) What do you understand by human poverty?
(ii) Who are the poorest of the poor?
(iii) What are the main features of the National Rural Employment Guarantee Act, 2005?
Answer : (i) Human poverty: This concept broadens the general definition of economic poverty by including the aspects like education, healthcare, job security etc. into the methodology of marking poverty line. This is basically a concept to help improve the human life standard instead of just ensuring mere sustenance.
(ii) The poorest of the poor: This category of economic standard means that the people in it are not economically capable of even meeting their basis sustenance requirements. This also can be used to describe the old people, children (especially the girl child) and the women who are conventionally not taken in consideration while making policies for the poor and unemployed.
(iii) Main features of the National Rural Employment Guarantee Act, 2005:
1. This provides 100 days assured employment every year to rural household in 200 districts of the country.
2. The scheme was extended to 600 districts later on.
3. Jobs were reserved for women and that also was one third.
4. If an applicant is not rendered employment within 15 days, then s/he will be entitled to a daily unemployment allowance.
5. For the implementation of this scheme, central government and state governments have established national employment guarantee funds and state employment guarantee funds respectively.
Please click on below link to download CBSE Class 9 Social Science Poverty As A Challenge Resource Worksheet
Free study material for Social Science
Economics Chapter 3 Poverty as a Challenge CBSE Class 9 Social Science Worksheet
Students can use the Economics Chapter 3 Poverty as a Challenge practice sheet provided above to prepare for their upcoming school tests. This solved questions and answers follow the latest CBSE syllabus for Class 9 Social Science. You can easily download the PDF format and solve these questions every day to improve your marks. Our expert teachers have made these from the most important topics that are always asked in your exams to help you get more marks in exams.
NCERT Based Questions and Solutions for Economics Chapter 3 Poverty as a Challenge
Our expert team has used the official NCERT book for Class 9 Social Science to create this practice material for students. After solving the questions our teachers have also suggested to study the NCERT solutions which will help you to understand the best way to solve problems in Social Science. You can get all this study material for free on studiestoday.com.
Extra Practice for Social Science
To get the best results in Class 9, students should try the Social Science MCQ Test for this chapter. We have also provided printable assignments for Class 9 Social Science on our website. Regular practice will help you feel more confident and get higher marks in CBSE examinations.
FAQs
You can download the teacher-verified PDF for CBSE Class 9 Social Science Poverty As A Challenge Resource Worksheet from StudiesToday.com. These practice sheets for Class 9 Social Science are designed as per the latest CBSE academic session.
Yes, our CBSE Class 9 Social Science Poverty As A Challenge Resource Worksheet includes a variety of questions like Case-based studies, Assertion-Reasoning, and MCQs as per the 50% competency-based weightage in the latest curriculum for Class 9.
Yes, we have provided detailed solutions for CBSE Class 9 Social Science Poverty As A Challenge Resource Worksheet to help Class 9 and follow the official CBSE marking scheme.
Daily practice with these Social Science worksheets helps in identifying understanding gaps. It also improves question solving speed and ensures that Class 9 students get more marks in CBSE exams.
All our Class 9 Social Science practice test papers and worksheets are available for free download in mobile-friendly PDF format. You can access CBSE Class 9 Social Science Poverty As A Challenge Resource Worksheet without any registration.