
Get the most accurate NCERT Solutions for Class 11 Mathematics Chapter 13 Statistics here. Updated for the 2026-27 academic session, these solutions are based on the latest NCERT textbooks for Class 11 Mathematics. Our expert-created answers for Class 11 Mathematics are available for free download in PDF format.
Detailed Chapter 13 Statistics NCERT Solutions for Class 11 Mathematics
For Class 11 students, solving NCERT textbook questions is the most effective way to build a strong conceptual foundation. Our Class 11 Mathematics solutions follow a detailed, step-by-step approach to ensure you understand the logic behind every answer. Practicing these Chapter 13 Statistics solutions will improve your exam performance.
Class 11 Mathematics Chapter 13 Statistics NCERT Solutions PDF
Exercise 15.1
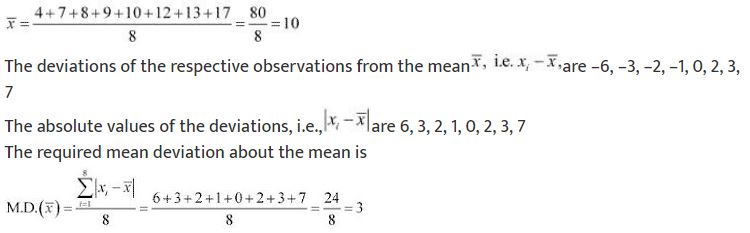
Question. Find the mean deviation about the mean for the data
4, 7, 8, 9, 10, 12, 13, 17
Answer :
The given data is
4, 7, 8, 9, 10, 12, 13, 17
Mean of the data,
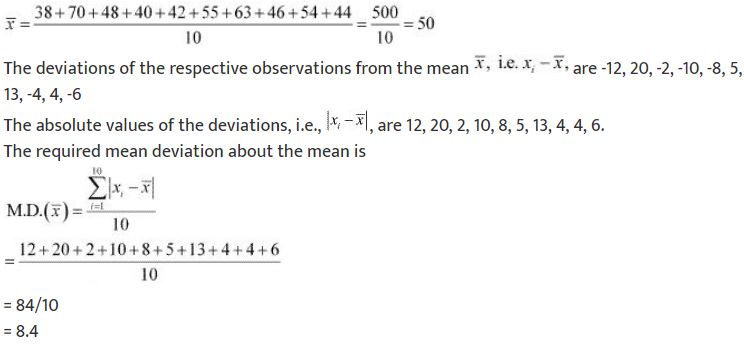
Question. Find the mean deviation about the mean for the data
38, 70, 48, 40, 42, 55, 63, 46, 54, 44
Answer :
The given data is
38, 70, 48, 40, 42, 55, 63, 46, 54, 44
Mean of the given data,
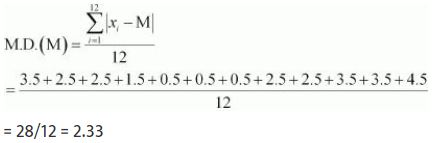
Question. Find the mean deviation about the median for the data.
13, 17, 16, 14, 11, 13, 10, 16, 11, 18, 12, 17
Answer :
The given data is
13, 17, 16, 14, 11, 13, 10, 16, 11, 18, 12, 17
Here, the numbers of observations are 12, which is even.
Arranging the data in ascending order, we obtain
10, 11, 11, 12, 13, 13, 14, 16, 16, 17, 17, 18

The deviations of the respective observations from the median, i.e. xi – M ,are
–3.5, –2.5, –2.5, –1.5, –0.5, –0.5, 0.5, 2.5, 2.5, 3.5, 3.5, 4.5
The absolute values of the deviations, |xi – M |, are
3.5, 2.5, 2.5, 1.5, 0.5, 0.5, 0.5, 2.5, 2.5, 3.5, 3.5, 4.5
The required mean deviation about the median is
Question. Find the mean deviation about the median for the data
36, 72, 46, 42, 60, 45, 53, 46, 51, 49
Answer :
The given data is
36, 72, 46, 42, 60, 45, 53, 46, 51, 49
Here, the number of observations is 10, which is even.
Arranging the data in ascending order, we obtain
36, 42, 45, 46, 46, 49, 51, 53, 60, 72

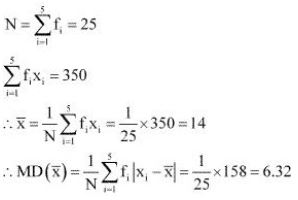
Question. Find the mean deviation about the mean for the data.
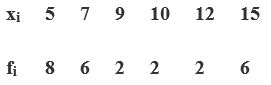
| xi | 5 | 10 | 15 | 20 | 25 |
| fi | 7 | 4 | 6 | 3 | 5 |
Answer :
xi | fi | fixi | ||
5 | 7 | 35 | 9 | 63 |
10 | 4 | 40 | 4 | 16 |
15 | 6 | 90 | 1 | 6 |
20 | 3 | 60 | 6 | 18 |
25 | 5 | 125 | 11 | 55 |
| 25 | 350 |
| 158 |
Question. Find the mean deviation about the mean for the data
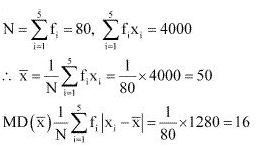
xi | 10 | 30 | 50 | 70 | 90 |
fi | 4 | 24 | 28 | 16 | 8 |
Answer :
xi | fi | fi xi |
|
|
10 | 4 | 40 | 40 | 160 |
30 | 24 | 720 | 20 | 480 |
50 | 28 | 1400 | 0 | 0 |
70 | 16 | 1120 | 20 | 320 |
90 | 8 | 720 | 40 | 320 |
80 | 4000 | 1280 |


Question. Find the mean deviation about the median for the data.
Answer :
The given observations are already in ascending order.
Adding a column corresponding to cumulative frequencies of the given data, we obtain the following table.
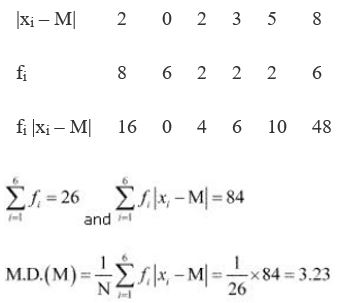
xi | fi | c.f. |
5 | 8 | 8 |
7 | 6 | 14 |
9 | 2 | 16 |
10 | 2 | 18 |
12 | 2 | 20 |
15 | 6 | 26 |
Here, N = 26, which is even.
Median is the mean of 13th and 14th observations. Both of these observations lie in the cumulative frequency 14, for which the corresponding observation is 7.
![]()
The absolute values of the deviations from median, i.e, |xi – M|, are
Question. Find the mean deviation about the median for the data
xi | 15 | 21 | 27 | 30 | 35 |
fi | 3 | 5 | 6 | 7 | 8 |
Answer :
The given observations are already in ascending order.
Adding a column corresponding to cumulative frequencies of the given data, we obtain the following table.
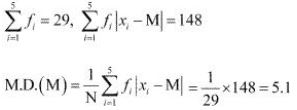
xi | fi | c.f. |
15 | 3 | 3 |
21 | 5 | 8 |
27 | 6 | 14 |
30 | 7 | 21 |
35 | 8 | 29 |
Here, N = 29, which is odd.
∴ Median = [(29 + 1)/2 ]th observation = 15th observation
This observation lies in the cumulative frequency 21, for which the corresponding observation is 30.
Median = 30
The absolute values of the deviations from median, i.e. |xi – M|, are
|xi – M| | 15 | 9 | 3 | 0 | 5 |
fi | 3 | 5 | 6 | 7 | 8 |
fi |xi – M| | 45 | 45 | 18 | 0 | 40 |
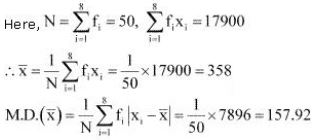
Question. Find the mean deviation about the mean for the data.
| Income per day | Number of persons |
| 0-100 | 4 |
| 100-200 | 8 |
| 200-300 | 9 |
| 300-400 | 10 |
| 400-500 | 7 |
| 500-600 | 5 |
| 600-700 | 4 |
| 700-800 | 3 |
Answer :
The following table is formed.
Income per day | Number of person fi | Mid – point xi | fi xi | | |
0 – 100 | 4 | 50 | 200 | 308 | 1232 |
100 – 200 | 8 | 150 | 1200 | 208 | 1664 |
200 – 300 | 9 | 250 | 2250 | 108 | 972 |
300 – 400 | 10 | 350 | 3500 | 8 | 80 |
400 – 500 | 7 | 450 | 3150 | 92 | 644 |
500 – 600 | 5 | 550 | 2750 | 192 | 960 |
600 – 700 | 4 | 650 | 2600 | 292 | 1168 |
700 – 800 | 3 | 750 | 2250 | 392 | 1176 |
50 | 17900 | 7896 |
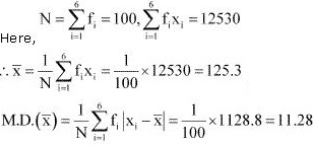
Question. Find the mean deviation about the mean for the data
| Height in cms | Number of boys |
| 95-105 | 9 |
| 105-115 | 13 |
| 115-125 | 26 |
| 125-135 | 30 |
| 135-145 | 12 |
| 145-155 | 10 |
Answer :
The following table is formed.
Height in cms | Number of boys fi | Mid – point xi | fi xi |
|
|
95 – 105 | 9 | 100 | 900 | 25.3 | 227.7 |
105 – 115 | 13 | 110 | 1430 | 15.3 | 198.9 |
115 – 125 | 26 | 120 | 3120 | 5.3 | 137.8 |
125 – 135 | 30 | 130 | 3900 | 4.7 | 141 |
135 – 145 | 12 | 140 | 1680 | 14.7 | 176.4 |
145 – 155 | 10 | 150 | 1500 | 24.7 | 247 |
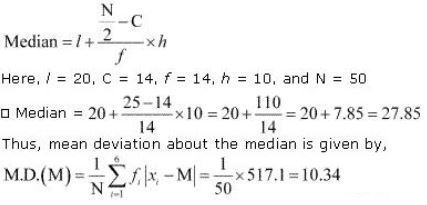
Question. Find the mean deviation about median for the following data:
| Marks | Number of girls |
| 0-10 | 6 |
| 10-20 | 8 |
| 20-30 | 14 |
| 30-40 | 16 |
| 40-50 | 4 |
| 50-60 | 2 |
Answer :
The following table is formed.
Marks | Number of boys fi | Cumulative frequency (c. f.) | Mid – point xi | |xi – Med.| | fi |xi – Med.| |
0 – 10 | 6 | 6 | 5 | 22.85 | 137.1 |
10 – 20 | 8 | 14 | 15 | 12.85 | 102.8 |
20 – 30 | 14 | 28 | 25 | 2.85 | 39.9 |
30 – 40 | 16 | 44 | 35 | 7.15 | 114.4 |
40 – 50 | 4 | 48 | 45 | 17.15 | 68.6 |
50 – 60 | 2 | 50 | 55 | 27.15 | 54.3 |
50 | 517.1 |
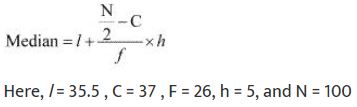
Question. Calculate the mean deviation about median age for the age distribution of 100 persons given below:
Age | Number |
16-20 | 5 |
21-25 | 6 |
26-30 | 12 |
31-35 | 14 |
36-40 | 26 |
41-45 | 12 |
46-50 | 16 |
51-55 | 9 |
Answer :
The given data is not continuous. Therefore, it has to be converted into continuous frequency distribution by subtracting 0.5 from the lower limit and adding 0.5 to the upper limit of each class interval.
The table is formed as follows.
Age | Number fi | Cumulative frequency (c.f.) | Mid – point xi | |xi – Med.| | fi |xi – Med.| |
15.5 – 20.5 | 5 | 5 | 18 | 20 | 100 |
20.5 – 25.5 | 6 | 11 | 23 | 15 | 90 |
25.5 – 30.5 | 12 | 23 | 28 | 10 | 120 |
30.5 – 35.5 | 14 | 37 | 33 | 5 | 70 |
35.5 – 40.5 | 26 | 63 | 37 | 0 | 0 |
40.5 – 45.5 | 12 | 75 | 43 | 5 | 60 |
45.5 – 50.5 | 16 | 91 | 48 | 10 | 160 |
50.5 – 55.5 | 9 | 100 | 53 | 15 | 135 |
100 | 735 |
The class interval containing the (N/2)th or 50th item is 35.5 - 40.5 .
Therefore, 35.5 - 40.5 is the median class.
It is known that,
Exercise 15.2
Question. Find the mean and variance for the data 6, 7, 10, 12, 13, 4, 8, 12.
Answer :
6, 7, 10, 12, 13, 4, 8, 12
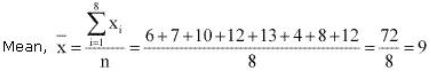
The following table is obtained.
xi | (xi – x̅) | (xi – x̅)2 |
6 | –3 | 9 |
7 | –2 | 4 |
10 | –1 | 1 |
12 | 3 | 9 |
13 | 4 | 16 |
4 | –5 | 25 |
8 | –1 | 1 |
12 | 3 | 9 |
|
| 74 |
![]()
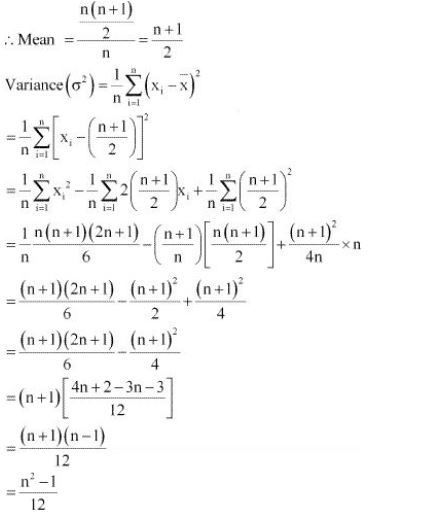
Question. Find the mean and variance for the first n natural numbers
Answer :
The mean of first n natural numbers is calculated as follows.
Mean = (Sum of all observations)/(Number of observations)
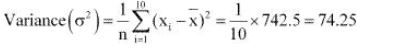
Question. Find the mean and variance for the first 10 multiples of 3.
Answer :
The first 10 multiples of 3 are
3, 6, 9, 12, 15, 18, 21, 24, 27, 30
Here, number of observations, n = 10
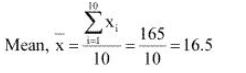
The following table is obtained.
xi | (xi – x̅) | (xi – x̅)2 |
3 | –13.5 | 182.25 |
6 | –10.5 | 110.25 |
9 | –7.5 | 56.25 |
12 | –4.5 | 20.25 |
15 | –1.5 | 2.25 |
18 | 1.5 | 2.25 |
21 | 4.5 | 20.25 |
24 | 7.5 | 56.25 |
27 | 10.5 | 110.25 |
30 | 13.5 | 182.25 |
|
| 742.5 |
Question. Find the mean and variance for the data
xi | 6 | 10 | 14 | 18 | 24 | 28 | 30 |
f i | 2 | 4 | 7 | 12 | 8 | 4 | 3 |
Answer :
The data is obtained in tabular form as follows.
xi | f i | fixi | (xi – x̅) | (xi – x̅)2 | fi(xi – x̅)2 |
6 | 2 | 12 | –13 | 169 | 338 |
10 | 4 | 40 | –9 | 81 | 324 |
14 | 7 | 98 | –5 | 25 | 175 |
18 | 12 | 216 | –1 | 1 | 12 |
24 | 8 | 192 | 5 | 25 | 200 |
28 | 4 | 112 | 9 | 81 | 324 |
30 | 3 | 90 | 11 | 121 | 363 |
40 | 760 | 1736 |

Question. Find the mean and variance for the data
xi | 92 | 93 | 97 | 98 | 102 | 104 | 109 |
f i | 3 | 2 | 3 | 2 | 6 | 3 | 3 |
Answer :
The data is obtained in tabular form as follows.
xi | f i | fixi | (xi – x̅) | (xi – x̅)2 | fi(xi – x̅)2 |
92 | 3 | 276 | –8 | 64 | 192 |
93 | 2 | 186 | –7 | 49 | 98 |
97 | 3 | 291 | –3 | 9 | 27 |
98 | 2 | 196 | –2 | 4 | 8 |
102 | 6 | 612 | 2 | 4 | 24 |
104 | 3 | 312 | 4 | 16 | 48 |
109 | 3 | 327 | 9 | 81 | 243 |
22 | 2200 | 640 |

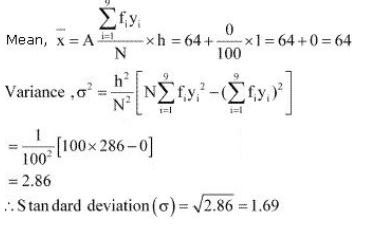
Question. Find the mean and standard deviation using short-cut method.
xi | 60 | 61 | 62 | 63 | 64 | 65 | 66 | 67 | 68 |
fi | 2 | 1 | 12 | 29 | 25 | 12 | 10 | 4 | 5 |
Answer :
The data is obtained in tabular form as follows.
xi | fi | Yi = (xi – A)/h | yi2 | fiyi | fiyi2 |
60 | 2 | –4 | 16 | –8 | 32 |
61 | 1 | –3 | 9 | –3 | 9 |
62 | 12 | –2 | 4 | –24 | 48 |
63 | 29 | –1 | 1 | –29 | 29 |
64 | 25 | 0 | 0 | 0 | 0 |
65 | 12 | 1 | 1 | 12 | 12 |
66 | 10 | 2 | 4 | 20 | 40 |
67 | 4 | 3 | 9 | 12 | 36 |
68 | 5 | 4 | 16 | 20 | 80 |
| 100 | 220 |
| 0 | 286 |
Question. Find the mean and variance for the following frequency distribution.
Classes | 0-30 | 30-60 | 60-90 | 90-120 | 120-150 | 150-180 | 180-210 |
Frequencies | 2 | 3 | 5 | 10 | 3 | 5 | 2 |
Answer :
Class | Frequency fi | Mid-point xi | fixi | (xi – x̅) | (xi – x̅)2 | fi(xi – x̅)2 |
0-30 | 2 | 15 | 30 | -92 | 8464 | 16928 |
30-60 | 3 | 45 | 135 | -62 | 3844 | 11532 |
60-90 | 5 | 75 | 375 | -32 | 1024 | 5120 |
90-120 | 10 | 105 | 1050 | -2 | 4 | 40 |
120-150 | 3 | 135 | 405 | 28 | 784 | 2352 |
150-180 | 5 | 165 | 825 | 58 | 3364 | 16820 |
180-210 | 2 | 195 | 390 | 88 | 7744 | 15488 |
30 | 3210 | 2 | 68280 |
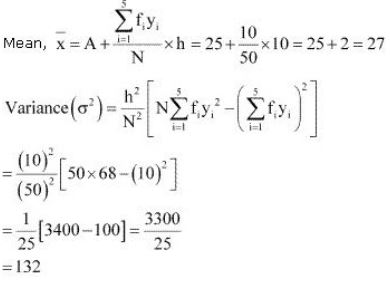
Question. Find the mean and variance for the following frequency distribution.
Classes | 0-10 | 10-20 | 20-30 | 30-40 | 40-50 |
Frequencies | 5 | 8 | 15 | 16 | 6 |
Answer :
Class | Frequency fi | Mid-point xi | fixi | (xi – x̅) | (xi – x̅)2 | fi(xi – x̅)2 |
0-10 | 5 | 5 | 25 | -22 | 484 | 2420 |
10-20 | 8 | 15 | 120 | -12 | 144 | 1152 |
20-30 | 15 | 25 | 375 | -2 | 4 | 60 |
30-40 | 16 | 35 | 560 | 8 | 64 | 1024 |
40-50 | 6 | 45 | 270 | 18 | 324 | 1944 |
50 | 1350 | 6600 |
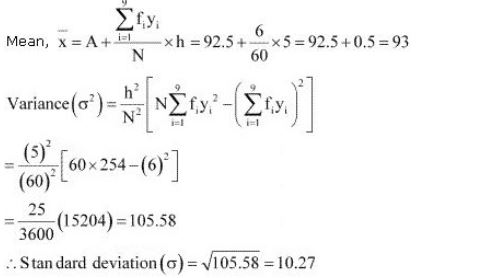
Question. Find the mean, variance and standard deviation using short-cut method
Height in cms | No. of children |
70-75 | 3 |
75-80 | 4 |
80-85 | 7 |
85-90 | 7 |
90-95 | 15 |
95-100 | 9 |
100-105 | 6 |
105-110 | 6 |
110-115 | 3 |
Answer :
Class Interval | Frequency fi | Mid-point xi | Yi = (xi – A)/h | yi2 | fiyi | fiyi2 |
70-75 | 3 | 72.5 | –4 | 16 | –12 | 48 |
75-80 | 4 | 77.5 | –3 | 9 | –12 | 36 |
80-85 | 7 | 82.5 | –2 | 4 | –14 | 28 |
85-90 | 7 | 87.5 | –1 | 1 | –7 | 7 |
90-95 | 15 | 92.5 | 0 | 0 | 0 | 0 |
95-100 | 9 | 97.5 | 1 | 1 | 9 | 9 |
100-105 | 6 | 102.5 | 2 | 4 | 12 | 24 |
105-110 | 6 | 107.5 | 3 | 9 | 18 | 54 |
110-115 | 3 | 112.5 | 4 | 16 | 12 | 48 |
60 | 6 | 254 |
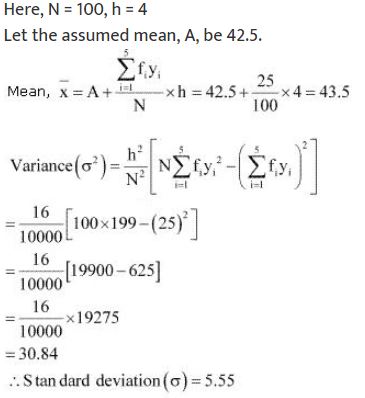
Question. The diameters of circles (in mm) drawn in a design are given below:
Diameters | No. of children |
33-36 | 15 |
37-40 | 17 |
41-44 | 21 |
45-48 | 22 |
49-52 | 25 |
Answer :
Class Interval | Frequency fi | Mid-point xi | Yi = (xi – A)/h | fi2 | fiyi | fiyi2 |
32.5-36.5 | 15 | 34.5 | –2 | 4 | –30 | 60 |
36.5-40.5 | 17 | 38.5 | –1 | 1 | –17 | 17 |
40.5-44.5 | 21 | 42.5 | 0 | 0 | 0 | 0 |
44.5-48.5 | 22 | 46.5 | 1 | 1 | 22 | 22 |
48.5-52.5 | 25 | 50.5 | 2 | 4 | 50 | 100 |
| 100 |
|
|
| 25 | 199 |
Exercise 15.3
Question. From the data given below state which group is more variable, A or B?
Marks | 10-20 | 20-30 | 30-40 | 40-50 | 50-60 | 60-70 | 70-80 |
Group A | 9 | 17 | 32 | 33 | 40 | 10 | 9 |
Group B | 10 | 20 | 30 | 25 | 43 | 15 | 7 |
Answer :
Firstly, the standard deviation of group A is calculated as follows.
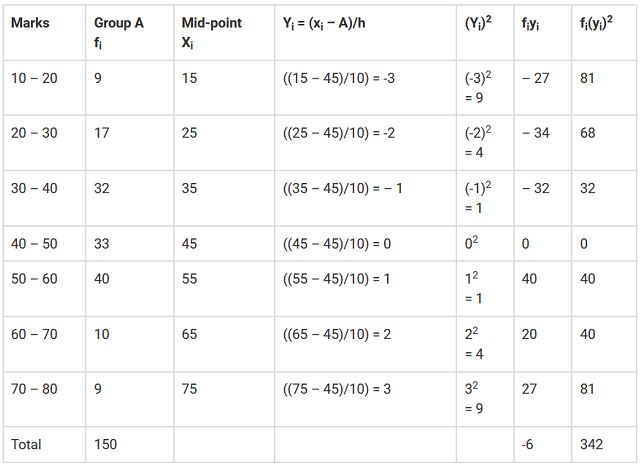
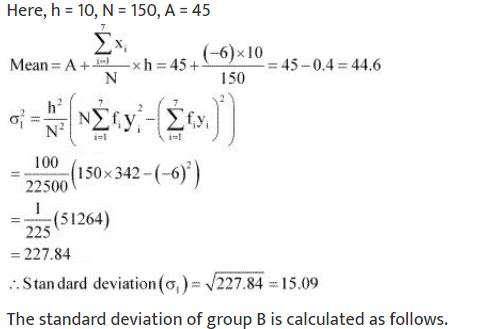
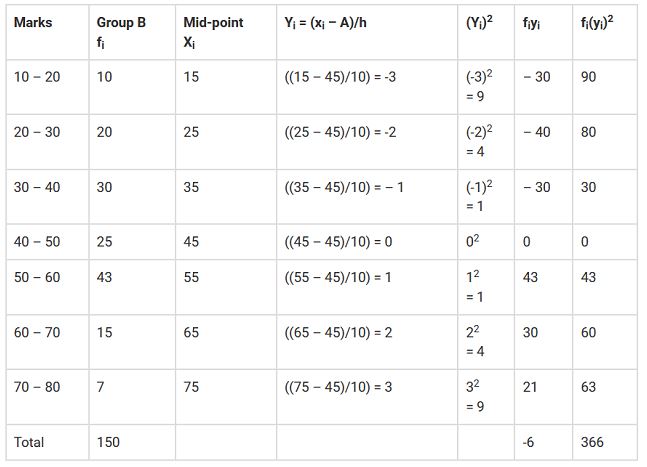
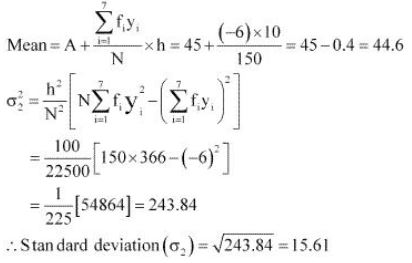
Since the mean of both the groups is same, the group with greater standard deviation will be more variable.
Thus, group B has more variability in the marks.
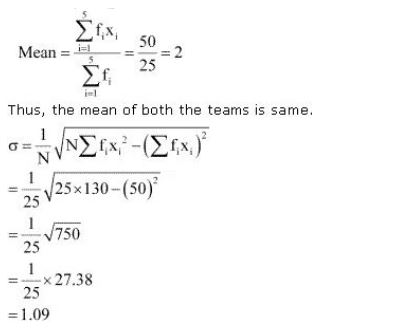
Question. From the prices of shares X and Y below, find out which is more stable in value:
X | 35 | 54 | 52 | 53 | 56 | 58 | 52 | 50 | 51 | 49 |
Y | 108 | 107 | 105 | 105 | 106 | 107 | 104 | 103 | 104 | 101 |
Answer :
The prices of the shares X are
35, 54, 52, 53, 56, 58, 52, 50, 51, 49
Here, the number of observations, N = 10
Question. An analysis of monthly wages paid to workers in two firms A and B, belonging to the same industry, gives the following results::
Firm A | Firm B | |
No. of wage earners | 586 | 648 |
Mean of monthly wages | Rs 5253 | Rs 5253 |
Variance of the distribution of wages | 100 | 121 |
(i) Which firm A or B pays larger amount as monthly wages?
(ii) Which firm, A or B, shows greater variability in individual wages?
Answer :
(i) Monthly wages of firm A = Rs 5253
Number of wage earners in firm A = 586
∴Total amount paid = Rs 5253 × 586
Monthly wages of firm B = Rs 5253
Number of wage earners in firm B = 648
∴Total amount paid = Rs 5253 × 648
Thus, firm B pays the larger amount as monthly wages as the number of wage earners in firm B are more than the number of wage earners in firm A.
(ii) Variance of the distribution of wages in firm A (σ12) = 100
∴ Standard deviation of the distribution of wages in firm
A ((σ1) = √100 = 10
Variance of the distribution of wages in firm B (σ22) = 121
∴ Standard deviation of the distribution of wages in firm B (σ22) = √121 = 11
The mean of monthly wages of both the firms is same i.e., 5253. Therefore, the firm with greater
standard deviation will have more variability.
Thus, firm B has greater variability in the individual wages.
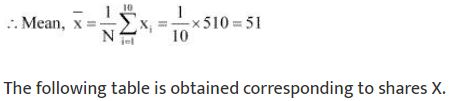
Question. The following is the record of goals scored by team A in a football session:
No. of goals scored | 0 | 1 | 2 | 3 | 4 |
No. of matches | 1 | 9 | 7 | 5 | 3 |
For the team B, mean number of goals scored per match was 2 with a standard deviation 1.25 goals. Find which team may be considered more consistent?
Answer :
The Mean and the standard deviation of goals scored by team A are calculated as follows.
No. of goals scored | No. of matches | fi xi | xi2 | fixi2 |
0 | 1 | 0 | 0 | 0 |
1 | 9 | 9 | 1 | 9 |
2 | 7 | 14 | 4 | 28 |
3 | 5 | 15 | 9 | 45 |
4 | 3 | 12 | 16 | 48 |
| 25 | 50 |
| 130 |
The standard deviation of team B is 1.25 goals.
The average number of goals scored by both the teams is same i.e., 2. Therefore, the team with lower standard deviation will be more consistent.
Thus, team A is more consistent than team B.
Question. The sum and sum of squares corresponding to length x (in cm) and weight y (in gm) of 50 plant products are given below:
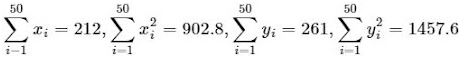
Which is more varying, the length or weight?
Answer :
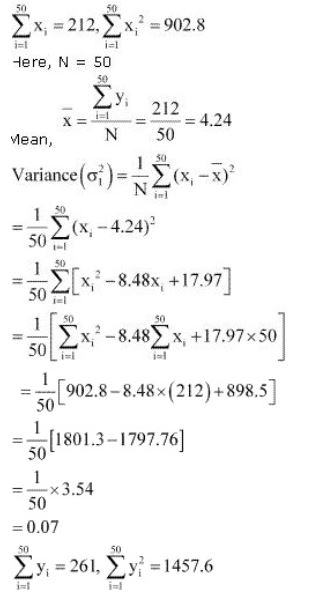
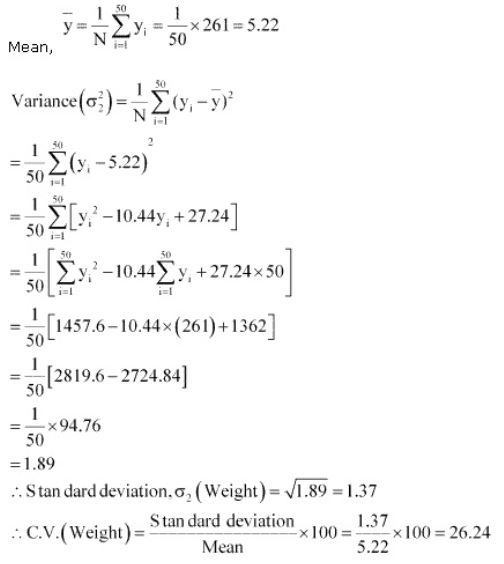
Thus, C.V. of weights is greater than the c.v. of lengths. Therefore, weights vary more than the lengths.
Miscellaneous Solutions
Question. The mean and variance of eight observations are 9 and 9.25, respectively. If six of the observations are 6, 7, 10, 12, 12 and 13, find the remaining two observations.
Answer :
Let the remaining two observations be x and y.
Therefore, the observations are 6, 7, 10, 12, 12, 13, x, y.
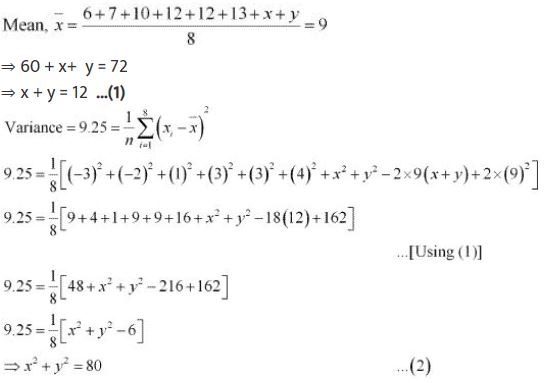
From (1), we obtain
x2 + y2 + 2xy = 144 …(3)
From (2) and (3), we obtain
2xy = 64 … (4)
Subtracting (4) from (2), we obtain
x2 + y2 – 2xy = 80 – 64 = 16
⇒ x – y = ± 4 …(5)
Therefore, from (1) and (5), we obtain
x = 8 and y = 4, when x – y = 4
x = 4 and y = 8, when x – y = –4
Thus, the remaining observations are 4 and 8.
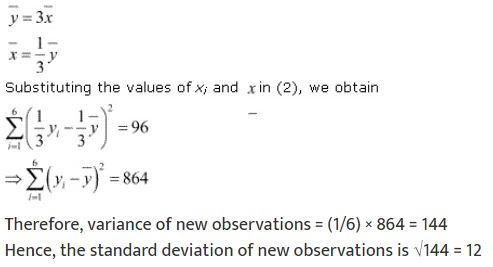
Question. The mean and variance of 7 observations are 8 and 16, respectively. If five of the observations are 2, 4, 10, 12 and 14. Find the remaining two observations.
Answer :
Let the observations be x1, x2, x3, x4, x5, and x6.
It is given that mean is 8 and standard deviation is 4.

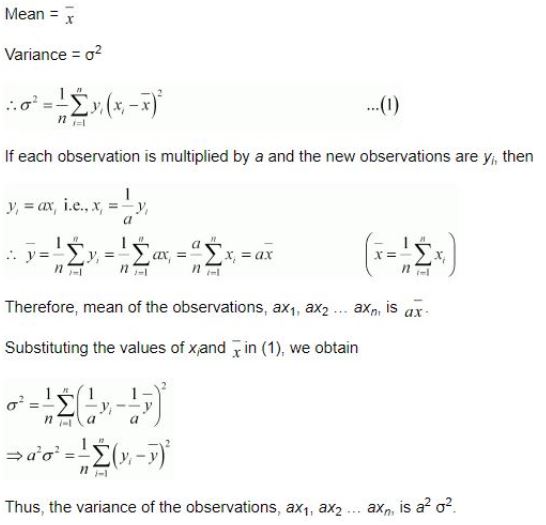
Question. Given that x is the mean and σ2 is the variance of n observations x1, x2 … xn. Prove that the mean and variance of the observations ax1, ax2, ax3 …axn are ax and a2 σ2, respectively (a ≠ 0).
Answer :
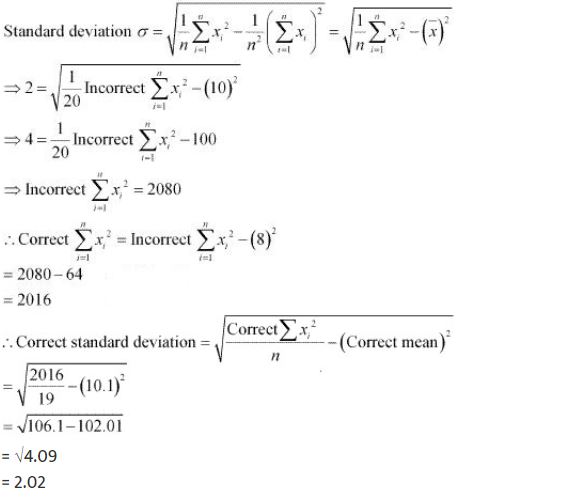
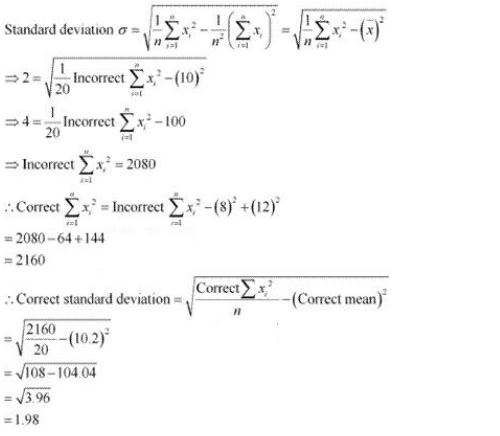
Question. The mean and standard deviation of 20 observations are found to be 10 and 2, respectively. On rechecking, it was found that an observation 8 was incorrect. Calculate the correct mean and standard deviation in each of the following cases:
(i) If wrong item is omitted.
(ii) If it is replaced by 12.
Answer :
(i) Number of observations (n) = 20
Incorrect mean = 10
Incorrect standard deviation = 2
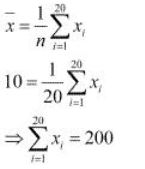
That is, incorrect sum of observations = 200
Correct sum of observations = 200 - 8 = 192
Correct mean = (Correct sum )/19 = 192/19 = 10.1
(ii) When 8 is replaced by 12,
Incorrect sum of observations = 200
Correct sum of observations = 200 - 8 + 12 = 204
∴ Correct mean = (Correct sum)/20 = 204/20 = 10.2
Question. The mean and standard deviation of marks obtained by 50 students of a class in three subjects, Mathematics, Physics and Chemistry are given below:
| Subject | Mathematics | Physics | Chemistry |
| Mean | 42 | 32 | 40.9 |
| Standard deviation | 12 | 15 | 20 |
Which of the three subjects shows the highest variability in marks and which shows the lowest?
Answer :
Standard deviation of Mathematics = 12
Standard deviation of Physics = 15
Standard deviation of Chemistry = 20
The coefficient of variation (C.V.) is given by (Standard deviation )/Mean × 100
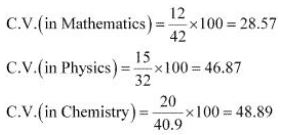
The subject with greater C.V. is more variable than others.
Therefore, the highest variability in marks is in Chemistry and the lowest variability in marks is in Mathematics.
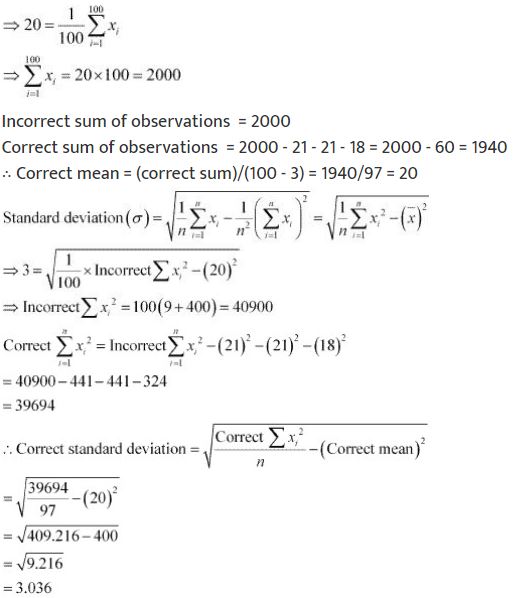
Question. The mean and standard deviation of a group of 100 observations were found to be 20 and 3, respectively. Later on it was found that three observations were incorrect, which were recorded as 21, 21 and 18. Find the mean and standard deviation if the incorrect observations are omitted.
Answer :
Number of observations (n) = 100
Incorrect mean x = 20
Incorrect standard deviation (σ) = 3
Free study material for Mathematics
NCERT Solutions Class 11 Mathematics Chapter 13 Statistics
Students can now access the NCERT Solutions for Chapter 13 Statistics prepared by teachers on our website. These solutions cover all questions in exercise in your Class 11 Mathematics textbook. Each answer is updated based on the current academic session as per the latest NCERT syllabus.
Detailed Explanations for Chapter 13 Statistics
Our expert teachers have provided step-by-step explanations for all the difficult questions in the Class 11 Mathematics chapter. Along with the final answers, we have also explained the concept behind it to help you build stronger understanding of each topic. This will be really helpful for Class 11 students who want to understand both theoretical and practical questions. By studying these NCERT Questions and Answers your basic concepts will improve a lot.
Benefits of using Mathematics Class 11 Solved Papers
Using our Mathematics solutions regularly students will be able to improve their logical thinking and problem-solving speed. These Class 11 solutions are a guide for self-study and homework assistance. Along with the chapter-wise solutions, you should also refer to our Revision Notes and Sample Papers for Chapter 13 Statistics to get a complete preparation experience.
FAQs
The complete and updated is available for free on StudiesToday.com. These solutions for Class 11 Mathematics are as per latest NCERT curriculum.
Yes, our experts have revised the as per 2026 exam pattern. All textbook exercises have been solved and have added explanation about how the Mathematics concepts are applied in case-study and assertion-reasoning questions.
Toppers recommend using NCERT language because NCERT marking schemes are strictly based on textbook definitions. Our will help students to get full marks in the theory paper.
Yes, we provide bilingual support for Class 11 Mathematics. You can access in both English and Hindi medium.
Yes, you can download the entire in printable PDF format for offline study on any device.