
Download the latest CBSE Class 10 Mathematics Statistics Notes Set 01 in PDF format. These Class 10 Mathematics revision notes are carefully designed by expert teachers to align with the 2026-27 syllabus. These notes are great daily learning and last minute exam preparation and they simplify complex topics and highlight important definitions for Class 10 students.
Revision Notes for Class 10 Mathematics Chapter 13 Statistics
To secure a higher rank, students should use these Class 10 Mathematics Chapter 13 Statistics notes for quick learning of important concepts. These exam-oriented summaries focus on difficult topics and high-weightage sections helpful in school tests and final examinations.
Chapter 13 Statistics Revision Notes for Class 10 Mathematics
CBSE Class 10 Mathematics - Statistics Concepts. Learning the important concepts is very important for every student to get better marks in examinations. The concepts should be clear which will help in faster learning. The attached concepts made as per NCERT and CBSE pattern will help the student to understand the chapter and score better marks in the examinations.
Class 10
Chapter : Statistics
Chapter Notes
Top Definitions
1. When a frequency distribution is obtained by dividing an ungrouped data in a number of strata, according to the value of variety under study, such information is called grouped data or classified data.
2. The cumulative frequency of a class is the frequency obtained by adding the frequencies of all the classes preceding the given class to the frequency of the class.
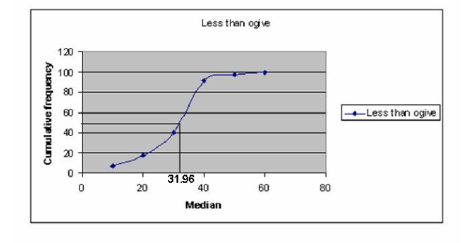
3. In a less than ogive the upper limit of a class is plotted against its cumulative frequency as a point on the ogive.
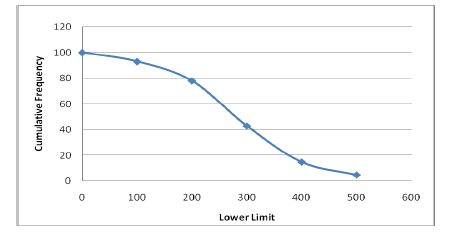
4. In a ‘more than ogive’ the upper limit of a class is plotted against its cumulative frequency as a point on the ogive.
5. The mode for ungrouped data is the value that occurs most often.
6. In the case of a grouped frequency distribution a class with maximum frequency is called as the modal class.
7. A distribution in which the values of mean, median and mode coincide (i.e. mean = median = mode) is known as a symmetrical distribution.
8. Distribution for which values of mean, median and mode are not equal is known as asymmetrical or skewed distribution.
Top Concepts
1. A cumulative frequency distribution can be represented graphically by means of an ‘ogive’.
2. The ogives can be drawn only when the given class intervals are continuous and if this is not the case then you don’t need to worry. All you need to do is simply make the class intervals continuous.
3. The ‘less than ogive’ is a rising curve.
4. The ‘more than ogive’ is a falling curve.
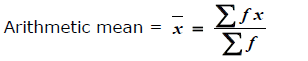
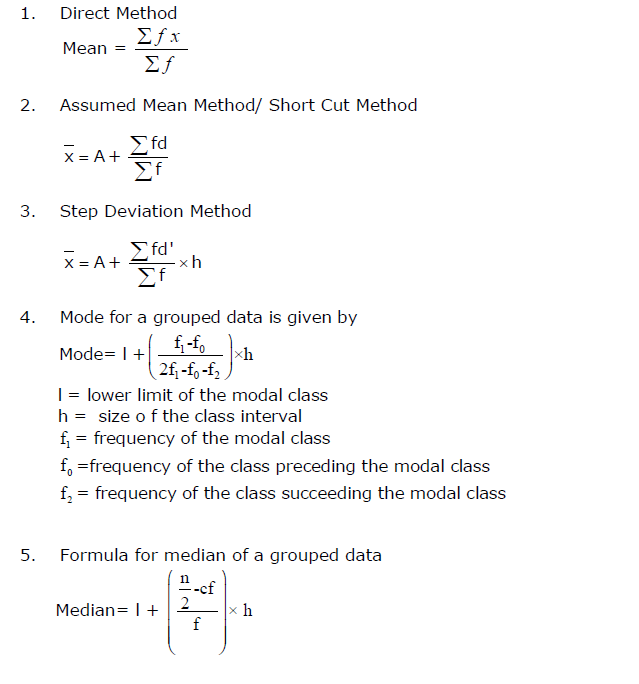
5. Direct Method of finding Mean
Step 1: First we find the mid values (also called class marks) of the intervals, denoted by ‘x’ or ‘m’
X=LowerLimit UpperLimit/2
Step 2: Multiply frequency with corresponding mid values obtained in
step1.
Step 3: Mean is calculated by using the following formula
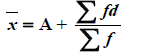
6. Short Cut Method/ Assumed Mean Method
Step1: Find the class marks
Step2: Find the assumed mean (A) from the mid values
Step 3: Calculate deviation (d), d = x – A
Step 4: find the product of frequency with the corresponding deviations
Step 5 : Calculate mean by using the following formula
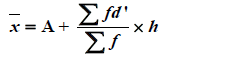
7. Step Deviation Method
Step1: Find the class marks
Step2: Find the assumed mean (A) from the mid values
Step 3: Calculate deviation (d). d = x – A
Step 4: After calculating deviations (d), we make one more column of values by dividing ‘d’ by ‘h’
Step 5: This is new value called step deviation (d’ or u) is multiplied with corresponding frequencies.
Step 6: Calculate mean by using the formula
8. The mode may be greater than, less than or even equal to the mean.
9. For finding the median we must arrange the given information i.e. the given data in increasing or decreasing order.
10. The last of the cumulative frequencies will be always equal to the total of all frequencies.
11. If the number of observations, n is even, so the median is the average of the (n/2)th observation and the (n/2+1)th observation.
12. The step deviation method will be convenient to apply if all the deviations (d’s) have a common factor
13. If class marks so obtained are in decimal form, then step deviation method is preferred to calculate mean.
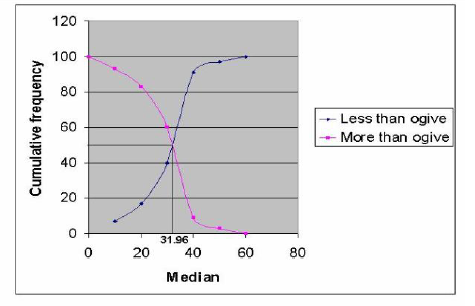
14. The median of a grouped data can be obtained graphically as the x coordinate of the point of intersection of two ogives for the data.
15. The most commonly used method of central tendency is the mean. The biggest problem with mean is that it is effected by the extreme values one large or small number can distort the average. In that case the median is a better measure of central tendency while when the most repeated value or the most wanted one is required, and then mode is used.
16. The most frequently used measure of central tendency is the mean, because the mean is calculated by taking into account all the observations of a given data. And it lies between the smallest and the largest value of the data.
17. In general, Mean median and mode could be connected as follows
* Mean<=Median<=Mode
* Mean>=Median>=Mode
* Mode
* Mode>Median and Mean>Median
Top Formulae
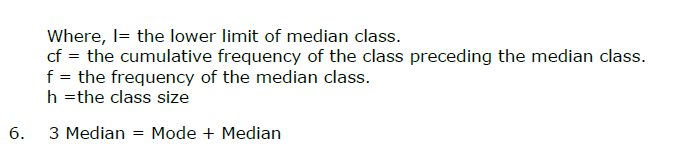
Top Diagrams
1. Less than Ogive
2. More than Ogive
3. Median calculated graphically.
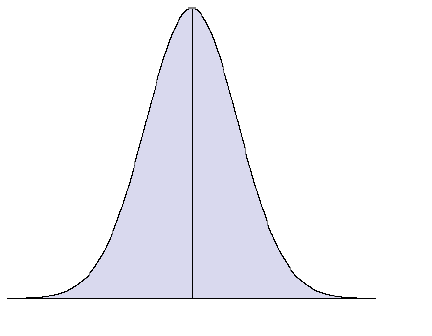
4. Symmetric Distribution
5. Asymmetrical or skewed distribution

Please click the link below to download pdf file for CBSE Class 10 Mathematics - Statistics Concepts.
Free study material for Mathematics
CBSE Class 10 Mathematics Chapter 13 Statistics Notes
Students can use these Revision Notes for Chapter 13 Statistics to quickly understand all the main concepts. This study material has been prepared as per the latest CBSE syllabus for Class 10. Our teachers always suggest that Class 10 students read these notes regularly as they are focused on the most important topics that usually appear in school tests and final exams.
NCERT Based Chapter 13 Statistics Summary
Our expert team has used the official NCERT book for Class 10 Mathematics to design these notes. These are the notes that definitely you for your current academic year. After reading the chapter summary, you should also refer to our NCERT solutions for Class 10. Always compare your understanding with our teacher prepared answers as they will help you build a very strong base in Mathematics.
Chapter 13 Statistics Complete Revision and Practice
To prepare very well for y our exams, students should also solve the MCQ questions and practice worksheets provided on this page. These extra solved questions will help you to check if you have understood all the concepts of Chapter 13 Statistics. All study material on studiestoday.com is free and updated according to the latest Mathematics exam patterns. Using these revision notes daily will help you feel more confident and get better marks in your exams.
FAQs
You can download the teacher prepared revision notes for CBSE Class 10 Mathematics Statistics Notes Set 01 from StudiesToday.com. These notes are designed as per 2026-27 academic session to help Class 10 students get the best study material for Mathematics.
Yes, our CBSE Class 10 Mathematics Statistics Notes Set 01 include 50% competency-based questions with focus on core logic, keyword definitions, and the practical application of Mathematics principles which is important for getting more marks in 2026 CBSE exams.
Yes, our CBSE Class 10 Mathematics Statistics Notes Set 01 provide a detailed, topic wise breakdown of the chapter. Fundamental definitions, complex numerical formulas and all topics of CBSE syllabus in Class 10 is covered.
These notes for Mathematics are organized into bullet points and easy-to-read charts. By using CBSE Class 10 Mathematics Statistics Notes Set 01, Class 10 students fast revise formulas, key definitions before the exams.
No, all study resources on StudiesToday, including CBSE Class 10 Mathematics Statistics Notes Set 01, are available for immediate free download. Class 10 Mathematics study material is available in PDF and can be downloaded on mobile.