

Class 8 Mathematics Chapter 22 Data Handling: Selina Concise Study Material
Access the official Selina Concise textbook solutions for Class 8 Mathematics, updated for the 2026-27 academic year. This digital resource is structured to help students build strong conceptual clarity and prepare effectively for school examinations.
Chapter 22 Data Handling Answer Guide
Access the complete PDF for Chapter 22 Data Handling below. This focused excerpt allows students to isolate specific topics for thorough review and uninterrupted reading, complementing standard ICSE textbooks.
Exercise 22(A)
Question 1. Arrange the following data as an array (in ascending order):
(i) 7, 5, 15, 12, 10, 11, 16
(ii) 6.3, 5.9, 9.8, 12.3, 5.6, 4.7
Answer:
(i) The values ordered from smallest to largest are: 5, 7, 10, 11, 12, 15, 16
(ii) The decimal values ordered from smallest to largest are: 4.7, 5.6, 5.9, 6.3, 9.8, 12.3
In simple words: Write the numbers starting from the smallest one and going up to the biggest one.
Exam Tip: Always count the total number of items in the original list and your sorted list to make sure no value is left out.
Question 2. Arrange the following data as an array (descending order):
(i) 0, 2, 0, 3, 4, 1, 2, 3, 5
(ii) 9.1, 3.7, 5.6, 8.3, 11.5, 10.6
Answer:
(i) The sequence arranged from largest to smallest is: 5, 4, 3, 3, 2, 2, 1, 0, 0
(ii) The decimals arranged in decreasing order are: 11.5, 10.6, 9.1, 8.3, 5.6, 3.7
In simple words: Arrange the values starting with the largest number and ending with the smallest.
Exam Tip: Watch out for repeating numbers, like 0 and 2, and ensure they are written next to each other in the final order.
Question 3. Construct a frequency table for the following data:
(i) 6, 7, 5, 6, 8, 9, 5, 5, 6, 7, 8, 9, 8, 10, 10, 9, 8, 10, 5, 7, 6, 8.
(ii) 3, 2, 1, 5, 4, 3, 2, 5, 5, 4, 2, 2, 2, 1, 4, 1, 5, 4.
Answer:
(i)
| Data | Tally Marks | Frequency |
|---|---|---|
| 5 | |||| | 4 |
| 6 | |||| | 4 |
| 7 | ||| | 3 |
| 8 | 5 | |
| 9 | ||| | 3 |
| 10 | ||| | 3 |
(ii)
| Data | Tally Marks | Frequency |
|---|---|---|
| 1 | ||| | 3 |
| 2 | 5 | |
| 3 | || | 2 |
| 4 | |||| | 4 |
| 5 | |||| | 4 |
In simple words: Count how many times each number appears and show this count using vertical tally lines.
Exam Tip: For tally marks, draw a diagonal line across four vertical lines to represent a group of five.
Question 4. Following are the marks obtained by 30 students in an examinations.
15 20 8 9 10
16 17 20 24 30
44 47 38 36 40
27 25 28 30 19
7 11 21 31 41
37 47 23 20 17
Taking class intervals 0-10, 10-20, ……… 40-50 ; construct a frequency table.
Answer:
| Class Intervals | Tally Marks | Frequency |
|---|---|---|
| 0-10 | ||| | 3 |
| 10-20 | 7 | |
| 20-30 | 9 | |
| 30-40 | 6 | |
| 40-50 | 5 |
In simple words: Group the marks into buckets of ten, like 0-10, and count how many students fall into each bucket.
Exam Tip: When placing data in class intervals like 10-20, the upper limit (20) is usually excluded and goes into the next interval (20-30).
Question 5. Construct a frequency distribution table for the following data ; taking class-intervals 4-6, 6-8, ……… 14-16.
11.5 6.3 7.8 9.2 10.5 4.5 6 8.3 12.5 15.8
7.4 5.3 8.4 15.2 8.9 9.8 8.25 6.5 5.8 10.5
4.6 6.4 8.9 10.8 12.7 14.2 15.3 11.7 9.9 8.8
6.6 4.3 4.7 9.4 10.1 15.5 14.4 12.2 7.7 5.5
Answer:
| Class Intervals | Tally Marks | Frequency |
|---|---|---|
| 4-6 | 7 | |
| 6-8 | 8 | |
| 8-10 | 10 | |
| 10-12 | 6 | |
| 12-14 | ||| | 3 |
| 14-16 | 6 |
In simple words: Group the decimals into ranges of two, like 4-6, and use tally marks to find the frequency of each range.
Exam Tip: Check all decimal numbers carefully as it is easy to misplace a decimal value into the wrong class interval.
Question 6. Fill in the blanks:
(i) Lower class limit of 15-18 is ………
(ii) Upper class limit of 24-30 is ……..
(iii) Upper limit of 5-12.5 is ………
(iv) If the upper and the lower limits of a class interval are 16 and 10 ; the class-interval is ……..
(v) If the lower and the upper limits of a class interval are 7.5 and 12.5 ; the class interval is ……..
Answer:
(i) The value 15 represents the lower limit of the class 15-18.
(ii) The value 30 represents the upper limit of the class 24-30.
(iii) The value 12.5 represents the upper limit of the class 5-12.5.
(iv) A class with limits of 16 and 10 is denoted as 10-16.
(v) A class with limits of 7.5 and 12.5 is denoted as 7.5-12.5.
In simple words: The lower limit of an interval is the smaller number on the left, and the upper limit is the larger number on the right.
Exam Tip: Remember that a class interval is represented as "lower limit - upper limit".
Exercise 22(B)
Question 1. Hundred students from a certain locality use different modes of travelling to school as given below. Draw a bar graph.
| Bus | Car | Rickshaw | Bicycle | Walk |
|---|---|---|---|---|
| 32 | 16 | 24 | 20 | 8 |
Answer:
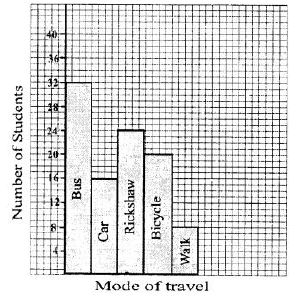
In simple words: Draw a vertical rectangle for each travel mode, where the height of the bar shows how many students use it.
Exam Tip: Label both axes clearly and use a consistent scale on the vertical axis so the bars are proportional.
Question 2. Mr. Mirza’s monthly income is Rs. 7,200. He spends Rs. 1,800 on rent, Rs. 2,700 on food, Rs. 900 on education of his children ; Rs. 1,200 on Other things and saves the rest. Draw a pie-chart to represent it.
Answer:
To represent this data on a pie-chart, the central angle is calculated as follows:
| Name of items | Expenditure/Saving in Rupees | Central angle |
|---|---|---|
| Rent | 1800 | \( \frac{1800}{7200} \times 360^\circ = 90^\circ \) |
| Food | 2700 | \( \frac{2700}{7200} \times 360^\circ = 135^\circ \) |
| Education | 900 | \( \frac{900}{7200} \times 360^\circ = 45^\circ \) |
| Others | 1200 | \( \frac{1200}{7200} \times 360^\circ = 60^\circ \) |
| Saving | 600 | \( \frac{600}{7200} \times 360^\circ = 30^\circ \) |
| Total | 7200 | 360° |
In simple words: Divide a circle into slices where each slice represents an item, and the size of the angle shows how much money is spent.
Exam Tip: Always show the formula used to calculate the central angle so the examiner can follow your steps clearly.
Question 3. The percentage of marks obtained, in different subjects by Ashok Sharma (in an examination) are given below. Draw a bar graph to represent it.
| English | Hindi | Maths | Science | Social Studies |
|---|---|---|---|---|
| 85 | 60 | 35 | 50 | 70 |
Answer:
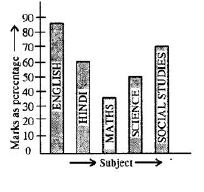
In simple words: Make a graph with vertical bars showing the percentage of marks for each school subject.
Exam Tip: Keep the width of all bars and the spaces between them exactly the same for a neat presentation.
Question 4. The following table shows the market position of different brand of tea-leaves.
Brand A B C D others
% Buyers 35 20 20 15 10
Draw it-pie-chart to represent the above information.
| Brand | A | B | C | D | others |
|---|---|---|---|---|---|
| % Buyers | 35 | 20 | 20 | 15 | 10 |
Answer:
The table below calculates the central angle for each brand:
| Name of brand | % Buyers | Central angle |
|---|---|---|
| A | 35 | \( \frac{35}{100} \times 360^\circ = 126^\circ \) |
| B | 20 | \( \frac{20}{100} \times 360^\circ = 72^\circ \) |
| C | 20 | \( \frac{20}{100} \times 360^\circ = 72^\circ \) |
| D | 15 | \( \frac{15}{100} \times 360^\circ = 54^\circ \) |
| Others | 10 | \( \frac{10}{100} \times 360^\circ = 36^\circ \) |
| Total | 100 | 360° |
Exam Tip: Ensure the sum of all calculated central angles adds up to exactly 360 degrees before drawing the pie chart.
Question 5. Students of a small school use different modes of travel to school as shown below:
Mode Bus Car Bicycle Auto On foot
No. of students 142 98 50 34 16
Draw a suitable bar graph.
| Mode | Bus | Car | Bicycle | Auto | On foot |
|---|---|---|---|---|---|
| No. of students | 142 | 98 | 50 | 34 | 16 |
Answer:
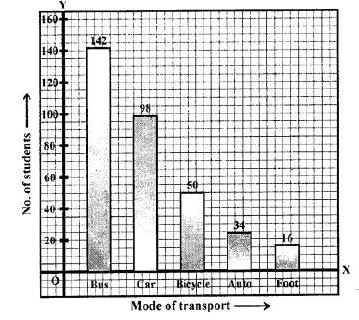
In simple words: Draw a bar graph where each bar represents a way students get to school, matching the given counts.
Exam Tip: Choose a convenient scale, like 1 division representing 20 students, to accommodate large numbers like 142 on your graph.
Question 6. For the following table, draw a bar-graph
A B C D E F
230 400 350 200 380 160
| A | B | C | D | E | F |
|---|---|---|---|---|---|
| 230 | 400 | 350 | 200 | 380 | 160 |
Answer:
In simple words: Represent the given data points with vertical bars of corresponding heights for categories A through F.
Exam Tip: Double-check that the height of each bar is accurately aligned with the values on the vertical axis.
Question 7. Manoj appeared for ICSE examination 2018 and secured percentage of marks as shown in the following table:
Subject Hindi English Maths Science Social Study
Marks as percent 60 45 42 48 75
Represent the above data by drawing a suitable bar graph.
| Subject | Hindi | English | Maths | Science | Social Study |
|---|---|---|---|---|---|
| Marks as percent | 60 | 45 | 42 | 48 | 75 |
Answer:
In simple words: Draw a bar graph to display Manoj's test percentages across five different school subjects.
Exam Tip: Start the vertical scale from zero to avoid misleading representations of the data.
Question 8. For the data given above in question number 7, draw a suitable pie-graph.
Answer:
Total percentage value: \( 60 + 45 + 42 + 48 + 75 = 270 \)
Let us determine the central angle for each subject: - Hindi: \( \frac{60}{270} \times 360^\circ = 80^\circ \) - English: \( \frac{45}{270} \times 360^\circ = 60^\circ \) - Maths: \( \frac{42}{270} \times 360^\circ = 56^\circ \) - Science: \( \frac{48}{270} \times 360^\circ = 64^\circ \) - Social Study: \( \frac{75}{270} \times 360^\circ = 100^\circ \) In simple words: Show Manoj's marks as slices of a circle, calculating each subject's angle based on a total of 270 marks.
Exam Tip: Use a protractor carefully to measure and draw each angle starting from the boundary of the previous slice.
Question 9. Mr. Kapoor compares the prices (in Rs.) of different items at two different shops A and B. Examine the following table carefully and represent the data by a double bar graph.
| Items | Price (in Rs.) at shop A | Price (in Rs.) at Shop B |
|---|---|---|
| Tea-set | 900 | 950 |
| Mixie | 700 | 800 |
| Coffee-maker | 600 | 700 |
| Dinner set | 600 | 500 |
Answer:
In simple words: Draw two bars side-by-side for each item to easily compare its price at shop A and shop B.
Exam Tip: Use a legend with distinct colors or shading patterns to differentiate between the two data sets in a double bar graph.
Question 10. The following tables shows the mode of transport used by boys and girls for going to the same school. Draw a double bar graph representing the above data.
| Bus | Bicycle | Walking | Other sources | |
|---|---|---|---|---|
| Number of boys | 80 | 60 | 20 | 85 |
| Number of girls | 90 | 75 | 35 | 60 |
Answer:
In simple words: Use pairs of adjacent bars to show and compare how boys and girls travel to school.
Exam Tip: Ensure the spacing between different pairs of bars is uniform and distinct from the space between the bars within a pair.
Step-by-Step Solutions for Class 8 Mathematics Chapter 22 Data Handling
Detailed Textbook Solutions: Chapter 22 Data Handling (Class 8 Mathematics)
Review accurate ICSE solutions for Chapter 22 Data Handling tailored for Class 8 Mathematics students. Use these step-by-step notes to simplify difficult textbook exercises and improve exam readiness.
Detailed Problem Solving for ICSE Class 8 Mathematics
Every exercise question in this chapter includes step-by-step working steps, allowing you to self-evaluate, catch mistakes early, and understand the underlying logic.
Next Steps in Your Class 8 Mathematics Preparation
Wrap up your chapter revision by verifying core concepts against standard ICSE question formats. All resources on our platform are free to access.
FAQs
You can download the verified Selina Concise solutions for Chapter 22 Data Handling on StudiesToday.com. Our teachers have prepared answers for Class 8 Mathematics as per 2026-27 ICSE academic session.
Yes, our solutions for Chapter 22 Data Handling are designed as per new 2026 ICSE standards. 40% competency-based questions required for Class 8, are included to help students understand application-based logic behind every Mathematics answer.
Yes, every exercise in Chapter 22 Data Handling from the Selina Concise textbook has been solved step-by-step. Class 8 students will learn Mathematics conceots before their ICSE exams.
Yes, follow structured format of these Selina Concise solutions for Chapter 22 Data Handling to get full 20% internal assessment marks and use Class 8 Mathematics projects and viva preparation as per ICSE 2026 guidelines.