
Refer to Analysis of Statistical Data MCQs provided below. Statistics MCQ questions with answers are available for download in Pdf. The MCQ Questions for Statistics with answers are aligned as per the latest syllabus and exam pattern suggested for your exams. Multiple Choice Questions for Analysis of Statistical Data are an important part of exams for Statistics and if practiced properly can help you to improve your understanding of Analysis of Statistical Data and get higher marks. Refer to more Chapter-wise MCQs for Statistics and also download more latest study material for all subjects
MCQ for Statistics Analysis of Statistical Data
Statistics students should refer to the following multiple-choice questions with answers for Analysis of Statistical Data
Analysis of Statistical Data MCQ Questions Statistics with Answers
Question. A function very similar to that of sorting letters in a post office is:
(a) Mean
(b) Standard deviation
(c) Classification
(d) Mean deviation
Answer: C
Question. If the class mid points in a frequency distribution of a group of persons are: 125, 132, 139, 146, 153, 160, 167, 174, 181 pounds, then the size of the class is:
(a) 6
(b) 8
(c) 7
(d) 9
Answer: C
Question. Type of bar diagram is:
(a) Pictogram
(b) Sub divided diagram
(c) Line diagrams
(d) Pie diagram
Answer: B
Question. The most commonly used device of presenting business and economic data is:
(a) Pie diagrams
(b) Pictograms
(c) Bar diagrams
(d) Line diagrams
Answer: C
Question. A systematic arrangement of data in rows and columns is:
(a) Table
(b) Tabulation
(c) Body
(d) All of the options
Answer: A
Question. The equity base of the companies remains unchanged, then the total divided earning by share holders in 1991-1992 is:
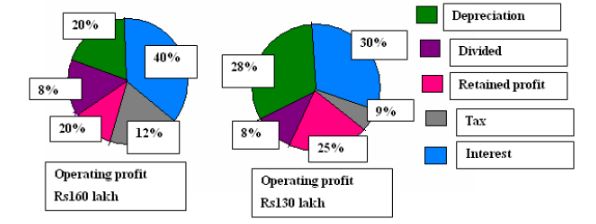
(a) Rs104 lakh
(b) Rs 9 lakh
(c) Rs12.8 lakh
(d) Rs15.6 lakh
Answer: C
Question. If the number of units of P is to be 3 times that of Q, what is the maximum idle time to maximize total units manufactured?
(a) 0 min
(b) 24 min
(c) 1 hr
(d) 2 hr
Answer: A
Question. In the statistical table column headings are called:
(a) Stubs
(b) Captions
(c) Source note
(d) None of the options
Answer: B
Question. From the below given graph, find what expenditure for the 7 years together from percent of the revenues together:
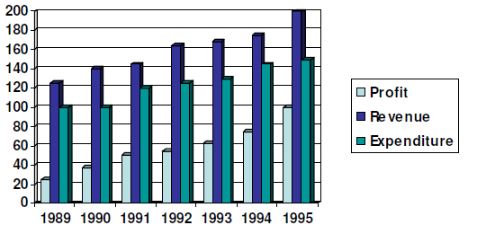
(a) 75%
(b) 67%
(c) 62%
(d) 83%
Answer: A
Question. In volume diagram the three dimensions which are taken into account are:
(a) Length, weight, breadth
(b) Height, weight, breadth
(c) Length, height, breadth
(d) Length, weight, height
Answer: C
Question. The different types of samplings are:
(a) Probability
(b) Judgement
(c) Mixed
(d) All of the options
Answer: D
Question. Standard error of the sampling distribution of a statistic t is:
(a) √ Standard deviation
(b) √ Median
(c) √ Variance
(d) √ Mean
Answer: C
Question. From the above graph in which year was the growth in expenditure maximum as compared to the previous year:
(a) 1993
(b) 1995
(c) 1991
(d) 1992
Answer: C
Question. What is the appropriate simple annual growth rate of total assets between 1990 and 1993?
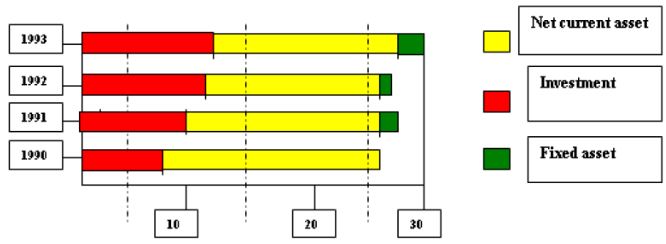
(a) 36%
(b) 12%
(c) 9%
(d) 27%
Answer: B
Question. The set of values of the statistic so obtained, one for each sample, constitutes what is called:
(a) Sampling distribution
(b) Systematic sampling
(c) Stratified sampling
(d) Cluster sampling
Answer: A
Question. The magnitude of the class is the:
(a) The product of lower limit and upper limit
(b) The sum of lower limit and upper limit
(c) The difference of upper limit and lower limit
(d) None of the options
Answer: C
Question. From the above figure answer the retained profit in 1991-1992 as compared to that in 1990- 1991 was:
(a) Higher by 2.5%
(b) Higher by 1.5%
(c) Lower by 2.5%
(d) Lower by 1.5%
Answer: D
Question. The numerical information in a statistical table is called the:
(a) Table
(b) Foot note
(c) Source note
(d) Body
Answer: D
Question. A pie diagram is also called:
(a) Pictogram
(b) Angular diagram
(c) Line diagram
(d) Bar diagram
Answer: B
Question. Convert the following into an ordinary frequency distribution:
5 students get less than3 marks; 12 students get less than 6 marks; 25 students get less than 9 marks; 33 students get less than 12 marks.
(a) (0—3)/5, (3—6)/7, (6— 9)/13, (9 —12)/8
(b) (0—3)/6, (3—6)/6, (6— 9)/14, (9 —12)/7
(c) (0—3)/4, (3—6)/8, (6—9)/12, (9 —12)/9
(d) (0—3)/6, (3—6)/8, (6—9)/12, (9 – 12)/7
Answer: A
Question. A professor keeps data on students tabulated by performance and sex of the students. The data is kept on the computer disk and due to virus the following data could be recovered. An expert committee was formed and it was decided. Half the students were either excellent or good. 40% of the students were female.1/3 of the male students were average.
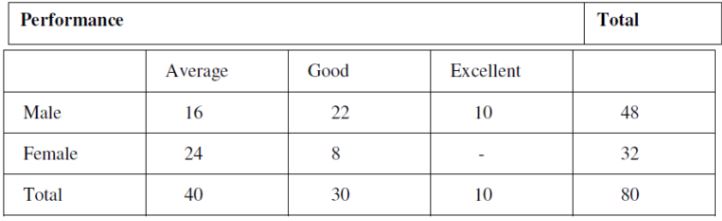
How many students are both female and excellent:
(a) 0
(b) 8
(c) 16
(d) 32
Answer: A
Question. Among every student what is the ratio of male and female:
(a) 1:2
(b) 2:1
(c) 3:2
(d) 2:3
Answer: D
Question. If a sample of size n from a given finite population of size N, then the total number of samples is:
(a) N! / (N –n)!
(b) N!
(c) N! /n!
(d) N! /n! (N – n )!
Answer: D
Question. The value lying half way between the upper limit and lower limit of the class is:
(a) Class interval
(b) Mid point
(c) Frequency
(d) None of the options
Answer: B
Question. In a statistical table the row headings are referred to as:
(a) Source note
(b) Captions
(c) Stubs
(d) Body
Answer: C
Question. Machine A as well as machine B can independently produce either product P or Q. The time taken by machine A and B in minutes to produce one unit of product P and Q is given as follows: (each machine works 8 hours per day)
Product A B
P 10 8
Q 6 6
If equal quantities of both are to be produced then out of the 4 choices the least efficient way would be
(a) 48 of each with 3 min idle
(b) 64 of each with 12 min idle
(c) 53 of each with 10 min idle
(d) 71 of each with 9 min idle
Answer: C
Question. Classes in which upper limits are excluded from the respective classes and are included in the immediate next class are:
(a) Open end classes
(b) Close end classes
(c) Inclusive classes
(d) Exclusive classes
Answer: D
Question. The mode of a frequency distribution can be determined graphically by:
(a) Histogram
(b) Frequency curve
(c) Frequency polygon
(d) Ogive
Answer: A
Question. The number of observations in a particular class is called:
(a) Width of the class
(b) Class mark
(c) Frequency
(d) None of the options
Answer: C
Question. If the mid points of the classes are 16, 24, 32, 40, and so on, then the magnitude of the class interval is:
(a) 8
(b) 9
(c) 7
(d) 6
Answer: A
Question. If the class mid points in a frequency distribution of age of a group of persons are 25, 32, 39, 46, 53 and 60. The size of class interval is:
(a) 5
(b) 7
(c) 8
(d) 6
Answer: B
Question. The first step in tabulation is:
(a) Foot note
(b) Source note
(c) Captions
(d) Classification
Answer: D
Question. One dimensional diagram is:
(a) Line diagram
(b) Rectangles
(c) Cubes
(d) Squares
Answer: A
Question. The median of a frequency distribution is found graphically with the help of:
(a) Histogram
(b) Frequency curve
(c) Frequency polygon
(d) Ogive
Answer: D
Question. Two dimensional diagrams used in surface diagrams are:
(a) Squares
(b) Pie diagrams
(c) Circles
(d) All of the options
Question. Find the median of the given ogive:
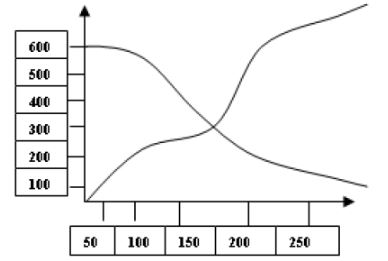
(a) 150
(b) 200
(c) 148
(d) 175
Answer: D
Question. In chronological classification, the data is classified on the basis of:
(a) Time
(b) Money
(c) Location
(d) Quality
Answer: A
Question. The classification of data according to location is what classification:
(a) Chronological
(b) Quantitative
(c) Qualitative
(d) Geographical
Answer: D
Question. The classes in which the lower limit or the upper limit is not specified are known as:
(a) Open end classes
(b) Close end classes
(c) Inclusive classes
(d) Exclusive classes
Answer: A
Question. From the figure given in Question 27, find the only item that has shown positive growth between 1991 and 1993?
(a) Net fixed assets
(b) Net current assets
(c) Investments
(d) Total assets
Answer: C
Statistics Analysis of Statistical Data MCQs with Answers
We hope you found the MCQs for Analysis of Statistical Data useful for your preparation. These questions have been designed as per the latest syllabus for Statistics to ensure complete coverage of the latest syllabus. Students are advised by our teachers to download Statistics MCQs in PDF format and practice these questions and solutions daily.
Best quality MCQs for Statistics Analysis of Statistical Data
Our expert teachers have referred to the latest textbooks to make these Statistics MCQs. Practicing these MCQs with answers daily will help get more marks and build a stronger understanding. You can also access specialized study material for Statistics to strengthen your understanding.
Analysis of Statistical Data Solved MCQs for Statistics
All questions provided here are as per the current academic year's books and syllabus. Our teachers have provided detailed answers for every Statistics MCQ to help you solve them yourself and then also verify your answers. We offer a full collection of MCQ questions for Statistics to ensure you can practice every topic within the chapter.
Benefits of Regular MCQ Practice for Analysis of Statistical Data
Consistent practice is the key to mastering Analysis of Statistical Data. Once you have solved these, we highly recommend attempting the online Statistics MCQ Test for the same chapter to improve your speed and accuracy.
Master Statistics Analysis of Statistical Data with Practice Sets
If you have upcoming tests, revise the concepts of Analysis of Statistical Data and then attempt these problems to identify any gaps in your knowledge. You can also explore our Sample Papers for Statistics to check your understanding level of these MCQs.
FAQs
You can download the MCQs for Statistics Analysis of Statistical Data for latest session from StudiesToday.com
Yes, the MCQs issued for Statistics Analysis of Statistical Data have been made available here for latest academic session
Learning Analysis of Statistical Data based MCQs will help students improve their overall understanding of important concepts and topics and help to score well in Statistics exams.
You can practice Analysis of Statistical Data through worksheets, textbooks and online quizzes provided by studiestoday.com.
You can find Statistics Analysis of Statistical Data MCQs on educational websites like studiestoday.com, online tutoring platforms, and in sample question papers provided on this website.
To prepare for Analysis of Statistical Data MCQs, refer to the concepts links provided by our teachers and download sample papers for free.
Yes, there are many online resources that we have provided on studiestoday.com available such as practice worksheets, question papers, and online tests for learning MCQs for Statistics Analysis of Statistical Data
Yes, you can find printable Analysis of Statistical Data worksheets for Statistics on studiestoday.com.
We have provided full database of free multiple choice questions with answers on studiestoday.com for Statistics Analysis of Statistical Data