
Read RD Sharma Solutions Class 9 Chapter 25 Probability below, students should study RD Sharma class 9 Mathematics available on Studiestoday.com with solved questions and answers. These chapter wise answers for class 9 Mathematics have been prepared by teacher of Grade 9. These RD Sharma class 9 Solutions have been designed as per the latest NCERT syllabus for class 9 and if practiced thoroughly can help you to score good marks in standard 9 Mathematics class tests and examinations
Exercise 25.1
Question 1. A coin is tossed 1000 times with the following frequencies:
Head: 455, Tail: 545
Compute the probability for each event.
Solution 1.
The coin is tossed 1000 times. So, Total number of trials is 1000.
Probability of Event (PE) = (Number of trials in which the event happened)/(Total number of trails)
The number of possible outcomes is two- Head (H) and Tail (T). Let E be the event ‘getting a head’.
So, Probability of getting Head = P(H) = (Number of Event Head)/(Total number of trails)
P(H) = 455/1000 = 0.455
Similarly, Probability of getting Tail = P(T) = (Number of Event Tails)/(Total number of trails)
P(H) = 545/1000 = 0.545
Question 2. Two coins are tossed simultaneously 500 times with the following frequencies of different outcomes:
Two heads: 95 times
One tail: 290 times
No head: 115 times
Find the probability of occurrence of each of these events.
Solution 2.
It is given that two coins are tossed simultaneously 500 times.
Probability of Event (PE) = (Number of trials in which the event happened)/(Total number of trails)
Probability of getting two head = P(getting two head) = (Number of Event of two heads)/(Total number of trails)
P(getting two heads) = 95/500 = 0.19
Similarly, Probability of getting one tail = P(getting one tail) = (Number of Event of one tails)/(Total number of trails)
P(getting one tail) = 290/500 = 0.58
Similarly, Probability of getting no head = P(getting no head) = (Number of Event of no head)/(Total number of trails)
P(getting no head) = 115/500 = 0.23
Question 3. Three coins are tossed simultaneously 100 times with the following frequencies of different outcomes:

If the three coins are simultaneously tossed again, compute the probability of:
(i) 2 heads coming up. (ii) 3 heads coming up
(iii) at least one head coming up. (iv) getting more heads than tails.
(v) getting more tails than heads.
Solution 3.
It is given that three coins are tossed simultaneously 100 times.
Probability of Event (PE) = (Number of trials in which the event happened)/(Total number of trails)
(i) Probability of getting 2 head coming up = P(getting two head) = (Number of Event of two heads)/(Total number of trails)
P(getting two heads) = 36/100 = 0.36
(ii) Probability of getting 3 heads coming up = P(getting 3 heads) = (Number of Event of 3 heads)/(Total number of trails)
P(getting 3 head) = 12/100 = 0.12
(iii) Probability of getting at least one head coming up =
P(getting at least one head) = (Number of Event of at least one head)/(Total number of trails)
Outcomes for getting at least one head coming up = 38+36+12 = 86
P(getting no head) = 86/100 = 0.86
(iv) Probability of getting more heads than tails =
P(getting more heads than tails ) = (Number of Event of at least one head)/(Total number of trails)
Outcomes for getting more heads than tails = 36+12 = 48
P(getting more heads than tails) = 48/100 = 0.48
(v) Probability of getting more tails than heads =
P(getting more tails than heads ) = (Number of Event of more tails than heads)/(Total number of trails)
Outcomes for getting more tails than heads = 14+38 = 52
P(getting more tails than heads) = 52/100 = 0.52
Question 4. 1500 families with 2 children were selected randomly and the following data were recorded:
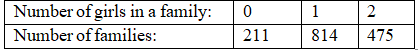
If a family is chosen at random, compute the probability that it has:
(i) No girl
(ii) 1 girl
(iii) 2 girls
(v) at most one girl
(v) more girls than boys
Solution 4.
It is given that there are total 1500 families.
(i) Probability of having no girl = P(having no girl) = (Number of families having no girl )/(Total number of families)
P(having no girl) = 211/1500 = 0.1406
(ii) Probability of having 1 girl = P(having 1 girl) = (Number of families having 1 girl )/(Total number of families)
P(having 1 girl) = 814/1500 = 0.5426
(iii) Probability of families having 2 girl = P(having 1 girl) = (Number of families having 2 girl )/(Total number of families)
P(having 2 girl) = 475/1500 = 0.3166
(iv) Probability of families having at most one girl =
P(having at most one girl) = (Number of families having at most one girl )/(Total number of families)
Total families having at most one girl = 211+814 = 1025
P(having at most one girl) = 1025/1500 = 0.6833
(v) Probability of families having more girls than boys =
P(having at more girl than boys) = (Number of families having at more girl than boys )/(Total number of families)
P(having at most one girl) = 475/1500 = 0.31
Question 5. In a cricket match, a batsman hits a boundary 6 times out of 30 balls he plays. Find the probability that on a ball played:
(i) he hits boundary.
(ii) he does not hit a boundary.
Solution 5.
It is given that in a cricket match, a batsman hits a boundary 6 times out of 30 balls.
Total number of balls = 30
Number of balls on boundaries he hit = 6times
Number of balls on batsman does not hit boundaries = 30 – 6 = 24days
(i) Probability of boundaries he hit =
P(he hits boundaries) = (Number of times he hits boundary)/(Total number balls played)
P(he hits boundaries) = 6/30 = 1/5 = 0.2
(ii) Probability of boundaries he does not hit =
P(he does not hit a boundaries) = (Number of times he does not hit boundary)/(Total number balls played)
P(he does not hit a boundaries) = 24/30 = 4/5 = 0.8
Question 6. The percentage of marks obtained by a student in monthly unit tests are given below:
Unit test: I II III IV V
Percentage of mark obtained: 69 71 73 68 76
Find the probability that the student gets:
(i) more than 70% marks
(ii) less than 70% marks
(iii) a distinction.
Solution 6.
(i) Student get more than 70% marks in unit test II, III and V.
Number of times student get more than 70% marks = 3
P(more than 70% marks) = (Number of times student having more than 70% marks)/(Total number unit test)
P(more than 70% marks) = 3/5 = 0.5
(ii) Student get more than 70% marks in unit test I and IV.
Number of times student get less than 70% marks = 2
P(less than 70% marks) = (Number of times student having less than 70% marks)/(Total number unit test)
P(less than 70% marks) = 2/5 = 0.4
(iii) Student get distinction marks in unit test V.
Number of times student get distinction marks = 1
P(distinction marks) = (Number of times student get distinction marks)/(Total number unit test)
P(distinction marks) = 1/5 = 0.2
Question 7. To know the opinion of the students about Mathematics, a survey of 200 students was conducted. The data is recorded in the following table:
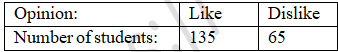
Find the probability that a student chosen at random
(i) Likes Mathematics
(ii) Does not like it.
Solution 7.
It is given that total number of Students = 200
(i) Number of student who like mathematics = 135
P(like mathematics) = (Number of student like mathematics)/(Total number students)
P(like mathematics) = 135/200 = 0.675
(ii) Number of students who dislike mathematics = 65
P(dislike mathematics) = (Number of student not like mathematics)/(Total number balls played)
P(dislike mathematics) = 65/200 = 0.325
Question 8. The blood groups of 30 students of class IX are recoded as follows:
A, B, O, O, AB, O, A, O, B, A, O, B, A, O, O,
A, AB, O, A, A, O, O, AB, B, A, O, B, A, B, O.
A student is selected at random from the class from blood donation. Find the probability that the blood group of the student chosen is:
(i) A
(ii) B
(iii) AB
(iv) O
Solution 8.
Total number of students = 30
(i) Number of student with blood group A = 9
P(with blood group A) = (Number of students with blood group A)/(Total number of students)
P(with blood group A) = 9/30 = 0.3
(ii) Number of student with blood group B = 6
P(with blood group B) = (Number of students with blood group B)/(Total number of students)
P(with blood group B) = 6/30 = 0.2
(iii) Number of student with blood group AB = 12
P(with blood group AB) = (Number of students with blood group AB)/(Total number of students)
P(with blood group AB) = 3/30 = 0.1
(iv) Number of student with blood group O = 12
P(with blood group AB) = (Number of students with blood group AB)/(Total number of students)
P(with blood group AB) = 12/30 = 0.4
Question 9. Eleven bags of wheat flour, each marked 5kg, actually contained the following weights of flour (in kg.):
4.97, 5.05, 5.08, 5.03, 5.00, 5.06, 5.08, 4.98, 5.04, 5.07, 5.00
Find the probability that any of these bags chosen at random contains more than 5kg. of flour.
Solution 9.
Total number of bags of wheat flour = 11bags
Numbers of bags with more than 5kg of weight are 5.05, 5.08, 5.03, 5.06, 5.08, 5.04 and 5.07.
The count of Number of bags with more than 5kg of weight are = 7
P(bags with more than 5kg of wheat flour) = (Number of bags with more than 5kg of wheat flour)/(Total number of students)
P(bags with more than 5kg of wheat flour) = 7/11
Question 10. Following table shows the birth month of 40 students of class IX.
Find the probability that a student was born in August.
Solution 10.
Total number of students = 40
Number of students born in august = 6
P(students born in august) = (Number of bags with more than 5kg of wheat flour)/(Total number of students)
P(students born in august) = 6/40 = 3/20
Question 11. Given below is the frequency distribution table regarding the concentration of sulphur dioxide in the air in parts per million of a certain city for 30 days.

Find the probability of concentration of sulphur dioxide in the interval 0.12-0.16 on any of these days.
Solution 11.
Total number of days = 30days
Concentration of sulphur dioxide in the interval 0.12-0.16 = 4
P(conc. of SO2 in the interval) = (Number of Concentration of sulphur dioxide in the interval 0.12-0.16)/(Total number of days)
P(conc. of SO2 in the interval) = 2/30 = 0.06
Question 12. Companies selected 2400 families at random and survey them to determine a relationship between income level and the number of vehicles in a home. The information gathered is listed in the table below:
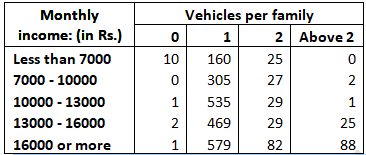
If a family is chosen, find the probability that the family is:
(i) earning Rs 10000-13000 per month and owning exactly 2 vehicles.
(ii) earning Rs 16000 or more per month and owning exactly 1 vehicle.
(iii) earning less than Rs 7000 per month and does not own any vehicle.
(iv) earning Rs. 13000-16000 per month and owning more than 2 vehicles.
(v) owning not more than 1 vehicle.
(vi) owning at least one vehicle.
Solution 12.
Total number of families = 2400
(i) Number of families earning Rs. 10000-13000 per month and owning exactly 2 vehicles = 29
P(earning Rs. 10000-13000 per month and owning exactly 2 vehicles) = (favorable outcomes )/(Total outcome)
P(earning Rs. 10000-13000 per month and owning exactly 2 vehicles) = 29/2400
(ii) Number of families earning Rs. 16000 or more per month and owning exactly 1 vehicle = 579
P(earning Rs. 16000 or more per month and owning exactly 1 vehicle) = (favorable outcomes )/(Total outcome)
P(earning Rs. 16000 or more per month and owning exactly 1 vehicle) = 579/2400
(iii) Number of families earning less than Rs 7000 per month and does not own any vehicle = 10
P(earning less than Rs 7000 per month and does not own any vehicle) = (favorable outcomes )/(Total outcome)
P(earning less than Rs 7000 per month and does not own any vehicle) = 10/2400 = 1/240
(iv) Number of families earning Rs. 13000-16000 per month and owning more than 2 vehicles = 25
P(earning Rs. 13000-16000 per month and owning more than 2 vehicles) = (favorable outcomes )/(Total outcome)
P(earning Rs. 13000-16000 per month and owning more than 2 vehicles) = 25/2400 = 1/96
(v) Number of families owning not more than 1 vehicle = 10+0+1+2+1+160+305+535+469+579 = 2062
P(families owning not more than 1 vehicle) = (favorable outcomes )/(Total outcome)
P(families owning not more than 1 vehicle) = 2062/2400 = 1031/1200
(vi) Number of families owning at least one vehicle = 160 + 305 + 535 + 469 + 579 + 25 + 27 + 29 + 29 + 82 + 0 + 2 + 1 +25 + 88 = 2356
P(families owning not more than 1 vehicle) = (favorable outcomes )/(Total outcome)
P(families owning not more than 1 vehicle) = 2356/2400 = 589/600
Question 13. The following table gives the life time of 400 neon lamps:
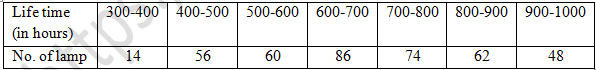
A bulb is selected at random. Find the probability that the life time of the selected bulb is:
(i) less than 400
(ii) between 300 to 800 hours.
(iii) at least 700 hours.
Solution 13.
Total number of lamps = 400
(i) Number of Lamps having less than 400 hours of life = 14
P(less than 400 hours) = (number of lamps having less than 400 hour of life )/(Total outcome)
P(less than 400 hours) = 14/400 = 7/200
(ii) Number of lamps having between 300 to 800 hours of life = 14+56+60+86+74 = 290
P(between 300 to 800 hours) = (number of lamps having between 300 to 800 hour of life )/(Total outcome)
P(between 300 to 800 hours) = 290/400 = 29/40
(iii) Number of lamps having at least 700 hours of life = 74+62+48 = 184
P(at least 700 hours) = (number of lamps having at least 700 hour of life )/(Total outcome)
P(at least 700 hours) = 184/400 = 23/50
Question 14. Given below is the frequency distribution of wages (in Rs.) of 30 workers in a certain factory:
A worker is selected at random. Find the probability that his wages are:
(i) less than Rs. 150
(ii) at least Rs. 210
(iii) more than or equal to 150 but less than Rs. 210.
Solution 14.
Total number of workers = 30
(i) Number of workers with less than Rs. 150 wages = 3 + 4 = 7
P(less than Rs. 150) = (Number of workers with less than Rs.150 wages )/(Total number workers)
P(less than Rs. 150) = 7/30
(ii) Number of workers with at least Rs. 210 wages = 4 + 3 = 7
P(at least Rs. 210) = (Number of workers with at least Rs.210 wages )/(Total number workers)
P(at least Rs. 210) = 7/30
(ii) Number of workers more than or equal to 150 but less than Rs. 210 = 5+6+5 =16
P(workers more than or equal to 150 but less than Rs. 210) = (Number of workers with at least Rs.210 wages )/(Total number workers)
P(workers more than or equal to 150 but less than Rs. 210) = 16/30 = 8/15