
Read and download free pdf of CBSE Class 12 Geography Population Distribution Density Growth And Composition Worksheet. Students and teachers of Class 12 Geography can get free printable Worksheets for Class 12 Geography Chapter 1 Population Distribution Density Growth and Composition in PDF format prepared as per the latest syllabus and examination pattern in your schools. Class 12 students should practice questions and answers given here for Geography in Class 12 which will help them to improve your knowledge of all important chapters and its topics. Students should also download free pdf of Class 12 Geography Worksheets prepared by school teachers as per the latest NCERT, CBSE, KVS books and syllabus issued this academic year and solve important problems with solutions on daily basis to get more score in school exams and tests
Worksheet for Class 12 Geography Chapter 1 Population Distribution Density Growth and Composition
Class 12 Geography students should refer to the following printable worksheet in Pdf for Chapter 1 Population Distribution Density Growth and Composition in Class 12. This test paper with questions and answers for Class 12 will be very useful for exams and help you to score good marks
Class 12 Geography Worksheet for Chapter 1 Population Distribution Density Growth and Composition
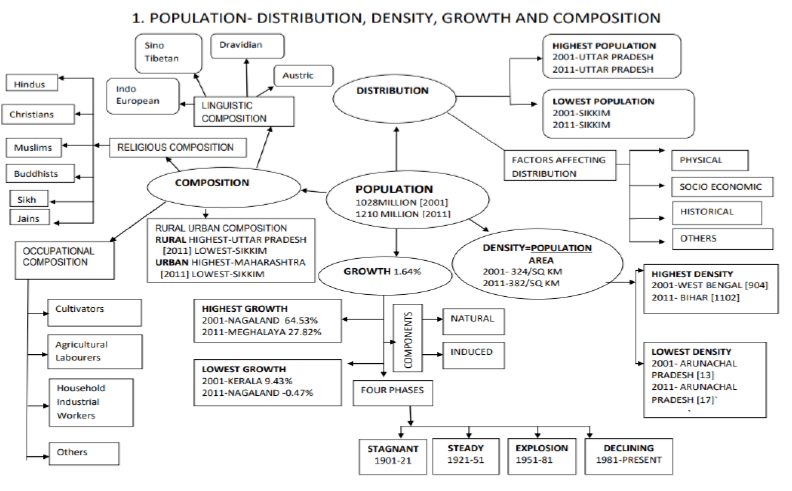
• India is the second most populous country after China in the world with its total population of 1,210 million (2011).
• India’s population is larger than the total population of North America, South America and Australia put together.
• Population data are collected through Census operation held every 10 years in our country.
Distribution of Population
• India has a highly uneven pattern of population distribution. UP has the largest share of population followed by Maharashtra, Bihar and West Bengal.
• U.P., Maharashtra, Bihar, West Bengal, Andhra Pradesh along with Tamil Nadu, Madhya Pradesh, Rajasthan, Karnataka and Gujarat, together account for about 76 per cent of the total population of the country. On the other hand, share of population is very small in the states like Jammu & Kashmir (1.04%), Arunachal Pradesh (0.11%) and Uttarakhand (0.84%) inspite of theses states having fairly large geographical area.
Physical Factors: Climate along with terrain and availability of water largely determines the pattern of population distribution. Northern Indian plains, coastal plains – deltas have higher concentration because of favourable physical factors unlike the mountains and deserts areas of our country where it is either too cold or too warm/dry.
Socio Economic & Historical Factors: Evolution of settled agriculture and agricultural development, pattern of human settlement, development of transport network, industrialization and urbanization are significant factors in determining population distribution. People settle in areas with favourable terrain, soil, climate, access to water (Ganga plains), minerals, industries (mining and industrial towns) and urban centres where conducive factors for settlement are available.
Density of Population
• Density of population is expressed as number of persons per unit area. It helps in getting a better understanding of the spatial distribution of population in relation to land.
• The density of population in India (2011) is 382 persons per sq km.
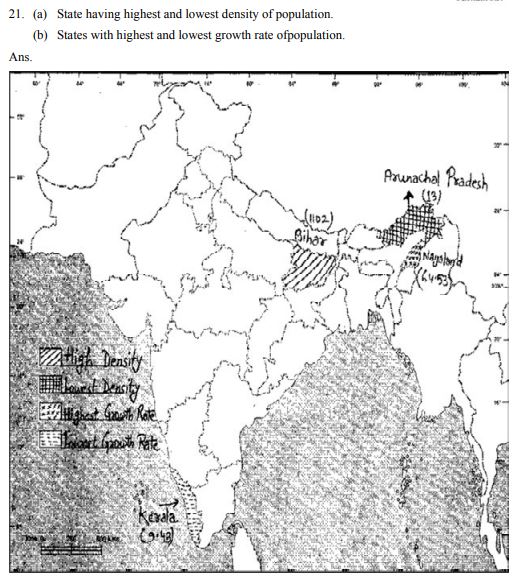
• It varies widely in the states from 17 persons per sq km in Arunachal Pradesh to 11,320 persons per sq km in the NCT, Delhi. Bihar has the highest density with 1106 persons per sq km.
• The hilly/rugged/desert areas have relatively low density due to terrain and harsh climate. Density is a crude measure of human and land relationship.
• To get a better insight into the human-land ratio in terms of pressure of population on total cultivable land, the physiological and the agricultural densities should be found out which are significant for a country like India having a large agricultural population.
• Physiological density = total population / net cultivated area
• Agricultural density = total agricultural population / net cultivable area
• Agricultural population includes cultivators and agricultural labourers and their family members.
Growth of population
• It is the change in the number of people living in a particular area between two points of time. Its rate is expressed in percentage. Population growth has two components namely; natural and induced.
• Natural growth is analysed by assessing the crude birth and death rates, the induced components are explained by the volume of inward and outward movement of people in any given area.
• The decadal and annual growth rates of population in India are both very high and steadily increasing over time. The annual growth rate of India’s population is 1.64 percent (2011).
• There are four phases of population growth in India (2011).
→ Phase I: 1901-1921 – Period of stagnant of growth since in this period growth rate was very low. Both the birth rate and death rate were high keeping the rate of increase low. Poor health and medical services, illiteracy of people at large and inefficient distribution system of food and other basic necessities were largely responsible for a high birth and death rates in this period.
→ Phase II: 1921-1951 – Period of steady growth. An overall improvement in health and sanitation throughout the country brought down the mortality rate. The crude birth rate remained high in this period leading to higher growth rate than the previous phase.
→ Phase III: 1951-1981 – Period of population explosion. The average annual growth rate was as high as 2.2 percent. After the Independence, the development activities through planning helped to improve living conditions leading to high Birth Rate. Apart from this, ‘international migration’ was also responsible bringing immigrants from other countries.
→ Phase IV: Post 1981 till present. The growth rate of country’s population though remained high, has started slowing down gradually. A downward trend of crude birth rate is held responsible for such a population growth. This was, in turn, affected by an increase in the mean age at marriage, improved quality of life particularly education of females in the country.
Regional Variation in Population Growth
• The States like Kerala, Karnataka, Tamil Nadu, Andhra Pradesh, Odisha, Puducherry, and Goa show a low rate of growth not exceeding 20 percent over the decade.
• A continuous belt of states comprising Gujarat, Maharashtra, Rajasthan, Punjab, Haryana, Uttar Pradesh, Uttarakhand, Madhya Pradesh, Sikkim, Assam, West Bengal, Bihar, Chhattisgarh, and Jharkhand, the growth rate on the average remained 20-25 percent.
• During 2001-2011, the growth rates of almost all States and Union Territories have registered a lower figure compared to the previous decade.
• At present the share of adolescents i.e., up to the age group of 10-19 years is about 20.9 percent (2011), among which male adolescents constitute 52.7 per cent and female adolescents constitute 47.3 per cent.
• The Government of India has undertaken certain policies to impart proper education to the adolescent groups so that their talents are better channelised and properly utilised.
• The National Youth Policy is one example which has been designed to look into the overall development of our large youth and adolescent population.
→ The National Youth Policy (NYP–2014) launched in February 2014 proposes a holistic ‘vision’ for the youth of India, which is “To empower the youth of the country to achieve their full potential, and through them enable India to find its rightful place in the community of nations”. The NYP–2014 has defined ‘youth’ as persons in the age group of 15–29 years.
→ The Government of India also formulated the National Policy for Skill Development and Entrepreneurship in 2015 to provide an umbrella framework to all skilling activities being carried out within the country, and to align these to common standards and link skilling with demand centres.
Population Composition
• It is the field of study with coverage of age, sex, residence, ethnic characteristics, tribes, language, religion, literacy and education, marital status, occupational characteristics, etc.
Rural – Urban Composition
• Compositions of population by their place of residence is an important indicator of socio-economic status of a country. In India 68.8% live in the villages.
• U.T. has smaller percentage of small rural population (Dadra and Nagar Haveli have 53% of rural people).
• Distribution of rural population reveals that both at Intra and Inter state levels, the relative degree of urbanisation and extent of rural-urban migration regulated the concentration of rural people.
• Urban population has increased in almost all the states and UTs – as a result of development in socio-economic conditions and rural-urban migration.
• Urban population is high along the main transport links in the North Indian plains, the industrial areas of Kolkata, Mumbai and other areas.
• It is low in the agriculturally stagnant areas of middle and lower Ganga plains, Telangana, non-irrigated western Rajasthan, remote hilly areas, desert, flood prone areas of Peninsular India, etc.
Linguistic Composition
• According to linguistic survey of India (1903- 1928), there were 179 languages and 544 dialects in India. In modern India, there are about 22 scheduled languages and many non-scheduled languages.
• Among the scheduled languages, the speakers of Hindi have the highest percentage. The smallest language groups are Sanskrit, Bodo and Manipuri speakers (2011).
• The speakers of major Indian languages belong to four languages families with their sub families and branches.
→ Four languages families are Austric, Dravidian, Sino-Tibetan and Indo-European.
Religious Composition
• Religion affects the cultural and political lives of most Indians.
• The spatial distribution of religious communities shows that certain states have more people.
• Hindu (70%–90%) form a major group in many states except the borders along Pakistan, Bangladesh, Tibet and in some scattered areas within the country.
• Muslim, the largest religious minority are mainly in J.K, some districts of West Bengal, Kerala, U.P and in the UTs of Delhi and Lakshadweep.
• Christians are most concentrated in the rural areas of Chotanagpur, hills of Manipur, Goa, Kerala, Mizoram, Meghalaya, Nagaland, etc.
• Sikhs are concentrated in Punjab, Haryana and Delhi.
•Jains and Buddhists form the smallest religious groups and are concentrated in selected areas. Jains in urban areas of Rajasthan, Gujarat and Maharashtra while the Buddhists in Maharashtra, Sikkim, Arunachal Pradesh, Ladakh, Tripura, Lahul and Spiti in Himachal Pradesh.
• The other religions of India include Zoroastrians, tribal and other indigenous faiths and beliefs concentrated in small pockets scattered throughout the country.
Composition of Working Population
• The population of India according to their economic status is divided into three groups, namely; main workers, marginal workers and non-workers.
• In India, the proportion of workers (both main and marginal) is only 39.8 per cent (2011) leaving a vast majority of about 60 per cent as non-workers.
• The proportion of working population, of the states and Union Territories show a moderate variation from about 39.6 per cent in Goa to about 49.9 per cent in Daman and Diu.
• About 54.6 percent of total working population are cultivators and agricultural labourers, whereas only 3.8% of workers are engaged in household industries and 41.6 % are other workers including non- household industries, trade, commerce, construction and repair and other services.
• Male workers out-number female workers in all the three sectors.
Promoting Gender Sensitivity through ‘Beti Bachao–Beti Padhao’ Social Campaign
• The division of the society into male, female and transgender is believed to be natural and biological. But, in reality, there are social constructs and roles assigned to individuals which are reinforced by social institutions.
• These biological differences become the basis of social differentiations, discriminations and exclusions.
• The Government of India has duly acknowledged the adverse impacts of these discriminations and launched a nationwide campaign called ‘Beti Bachao – Beti Padhao’.
• The number of female workers is relatively high in primary sector, though in recent years there has been some improvement in work participation of women in secondary and tertiary sectors.
• The spatial variation of work participation rate in different sectors in the country is very wide.
→ The states like Himachal Pradesh and Nagaland have very large shares of cultivators.
→ On the other hand states like Bihar, Andhra Pradesh, Chhattisgarh, Odisha, Jharkhand, West Bengal and Madhya Pradesh have higher proportion of agricultural labourers. → The highly urbanised areas like Delhi, Chandigarh and Puducherry have a very large proportion of workers being engaged in other services.
Question. The average density of population of India (2011) is per km.
(A) 216
(B) 382
(C) 221
(D) 324
Answer. B
Question. Which state has the largest population?
(A) Uttar Pradesh
(B) West Bengal
(C) Kerala
(D) Punjab
Answer. A
Question. Which state has the highest density of population?
(A) Haryana
(B) Uttar Pradesh
(C) West Bengal
(D) Bihar
Answer. D
Question. Which state has the highest sex ratio?
(A) Kerala
(B) Himachal Pradesh
(C) Odisha
(D) Tamil Nadu
Answer. A
Question. Where does India rank as a world population?
(A) First
(B) Second
(C) Fifth
(D) Seventh
Answer. B
Question. When was the first census held in India?
(A) 1871
(B) 1881
(C) 1891
(D) 1861
Answer. B
Question. How much percent of World’s population is in India?
(A) 10.7%
(B) 12.7%
(C) 16.7%
(D) 18.7%
Answer. C
Question. Which state has the lowest population?
(A) Punjab
(B) Sikkim
(C) Assam
(D) Rajasthan
Answer. B
Question. Which state has the lowest density of population?
(A) Haryana
(B) Rajasthan
(C) Arunachal
(D) Mizoram
Answer. C
Question. In how many years India’s population will be doubled?
(A) 32 years
(B) 34 years
(C) 36 years
(D) 38 years
Answer. C
Question. India’s population as per the 2011 census is:
(A) 1028 million
(B) 3287 million
(C) 3182 million
(D) 1210 million
Answer. D
Question. Which one of the following states has the highest proportion of the urban population in India according to the 2001 Census?
(A) Tamil Nadu
(B) Kerala
(C) Maharashtra
(D) Goa
Answer. D
Question. Which one of the following is the largest linguistic group of India?
(A) Sino-Tibetan
(B) Austric
(C) Indo-Aryan
(D) Dravidian
Answer. C
Question. State the four phases into which Indian demographic history is divided.
Answer. The process of change in a society, population is called the demographic Transition. It consists of four stages in India:
- Period of Stagnant growth rate—Before 1921 (High death and birth rates)
- Period of Steady growth rate—1921 to 1951 (High birth rate low declining death rate)
- Period of rapid growth rate —1951 tol981 (Death rate declining faster than birth rate)
- Period of declining growth rate—(after 1981) (Low birth rate and low death rate)
Question. ‘The distribution of population is highly uneven in India.’ Give three examples.
Answer. India has an uneven distribution of population: - Plains have more population than mountains, deserts and forested lands have less population. - Large states have greater population. - River basins and coastal plains have dense population.
Question. Explain the factors responsible for low female participation in economic activities.
Answer. - Joint family system
- Low educational and social state of female
- Frequent childbirth
- Lack of suitable employment opportunities
Question. Write down the major causes responsible for the variations in the growth rate of northern and southern India.
Answer. - Literacy rate is higher in the southern states
- Urban population is higher in southern states than the northern states.
- Southern states have higher economic development.
- Birth rate in southern states is comparatively lower.
Question. “Apart from birth and death, migration is another way by which the population size changes.” Justify the statement.
Answer. Migration is one of the major factors that affects the population change. Rural urban migration is important factor contributing to the population growth of cities. Population declines due to out-migration or immigration of people to foreign countries. Population increases due to in-migration or immigration of people from foreign countries.Internal migration does not make any change but international migration makes the differences in the size of population. Marriage is a social factor which changes the size of population. Facilities of education, health, etc. inspire people to migrate. Due to employment facilities people migrate from their birth place.
GIST OF THE LESSON:
LANDUSE CATEGORIES
1. Forests
2. Land put to non-agricultural use
3. Barren and waste land
4. Are aunder permanent pastures
5. Areaunder miscellaneous tree crops
6. Culturallywaste land
7. Current fallow land
8. Fallow other than current fallow
9. Net sown area
LAND USE CHANGES IN INDIA THREE TYPES OF CHANGES
I. Sizeof economy: growover time; change in income level, marginal lands will become useful
II. Composition of the economy: the secondary and tertiary grewmuch faster than primary activities especially agriculture
III. The contribution of agricultural activities reduces over time The share of Aggriculture is declined. No. of people fed by Aggriculture is increasing
INCREASE IN THREE CATEGORIES
1. Forest
2. Area under non agricultural use
3. Current fallow land
4. Four areas declined
1. Barren and waste land
2. Cultivable waste land
3. Area under pastures & tree crops
4. Net sown area
COMMON PROPERTY RESOURCES
I. The CPRs are used by common purpose / society owned by state
ii. Provide fodder for livestock fuel for the house holds
iii. Produce minor forest products such as fruits, nuts, fiber, and medicinal plants
iv. Every member has right to access agricultural land use in India
1. Contribution of land in agricultural use is more important
2. Lack of access to land leads to poverty
3. Productivity depends on quality of land
4. Land ownership has social value in rural areas
TOTAL CULTIVABLE LAND IS = NET SWOWN AREA + FALLOW LAND + CULTURABLE WASTE LAND
1. Since there is no extra land available only the high yielding varieties can increase the productivity
2. Number of times the land can be increased by providing irrigation
Crop intensity can be raised
CROPPING SEASONS (tbl)
STRATEGY OF DEVELOPMENT
Govt. of India took steps to increase the production
i. Switching over from cash crops to food grains
ii. Increase crop intensity
iii. Increasing cultivated area
iv. Improvement of irrigation
v. Intensive agricultural district programme and intensive agricultural area programme were launched
vi. Useof HYV seeds, fertilizers, irrigation, pesticides,
vii. Useof package technology
viii. Introduction of GREEN REVOLUTION
ix. Large agricultureinputs
GROWTH OFAGRICULTURALOUTPUTAND TECHNOLOGY
1. Production and yield increased (wheat, rice, oilseeds, sugarcane, tea pulses, cattle, milk, and ground nut)
2. Expansion of irrigated area3. Useof HYV seeds
4. Useof modern agricultural technology
5. Increased consumption of chemical fertilizers
PROBLEMS OF INDIAN AGRICULTURE
1. Uneven and unreliable rainfall
2. Low productivity
3. Povertyof the farmers
4. Lack of landreforms
5. Fragmentation of land holdings
6. Lack of commercialization
7. Vast under employment
8. Degradation of cultivableland.
9. Illiteracy
Very short Answer question
Question. Which state is the leading producer of rice?
Answer: West Bengal
Question. How much part of total geographical area is cultivated?
Answer: 43%
Question. What is follow land?
Answer: A land which is not cultivated for 1 to 5 years.
Question. Which state has the highest intensity of crops?
Answer: Punjab 189%
Question. Name the main cropping season of India.
Answer: Rabi, kharif and zaid
Short answer question
Question. What is the difference between dry land and wetland farming?
Answer: Dry land farming:
1. Dryland farming located in the area of less than 75cm rain fall
2. Drought resistant crops are grown
3. Millets, maizefodder crops
4. Practice rain water harvesting
Wetland farming:
1. Found in areas of high rainfall zones
2. Water intensive crops such as rice, sugarcane, jute are grown
Question. Describe the condition of growth, production and major area of cultivation of rice in India.
Answer: RICE is a crop of tropical reasons
Temperature: 20 to 27 degree centigrade.
Rainfall: 75 to 200 cm
Soil: Alluvial
Cheap and skilled labour : large no of labour required Production area :middle plain, coastal plain, Himalaya foot hill, Punjab, Haryana
Question. Describe three main achievements of the green Revolution in India.
Answer:
i) it has led to a substantial increase in production and productivity of food grains.
ii) Import of food grains declined from 10. 3 million tons to 2.4 million tones in 1983. There is no import of food grains in 2000-01.
The cropped area, use of HYVs, the yield per hectare use of irrigation and Fertilizers has increased.
Long answer question
Question. Discuss the problems of Indian agriculture?
Answer:
1. Uneven and unreliable rainfall
2. Low productivity
3. Poverty of the farmers
4. Lack of landreforms
5. Fragmentation of land holdings
6. Lack of commercialization
7. Vast under employment
8. Degradation of cultivableland
9. Illiteracy
Question. What geographical condition is required to grow wheat?
Answer:
i) Temperature: 10 to 20 degree Celsius and 100 frost free period
ii) Rainfall: need 50 to 100 cm of rainfall
iii) Irrigation: Irrigation is required
iv) Soil: heavy loamy or light clay is the best
v) Production in India: Punjab, Haryana, India is the second largest wheat
vi) Producing country after green revolution.
| CBSE Class 12 Geography Human Nature And Scope Worksheet |
| CBSE Class 12 Geography The World Population Distribution Density And Growth Worksheet |
| CBSE Class 12 Geography Population Composition Worksheet |
| CBSE Class 12 Geography Human Development Worksheet |
| CBSE Class 12 Geography Primary Activities Worksheet |
| CBSE Class 12 Geography Secondary Activities Worksheet |
| CBSE Class 12 Geography Tertiary And Quaternary Activities Worksheet |
| CBSE Class 12 Geography Transport And Communication Worksheet |
| CBSE Class 12 Geography International Trade Worksheet |
| CBSE Class 12 Geography Human Settlements Worksheet |
| CBSE Class 12 Geography Population Distribution Density Growth And Composition Worksheet |
| CBSE Class 12 Geography Water Resources Worksheet |
| CBSE Class 12 Geography Manufacturing Industries Worksheet |
| CBSE Class 12 Geography Planning And Sustainable Development In India Worksheet |
More Study Material
CBSE Class 12 Geography Chapter 1 Population Distribution Density Growth and Composition Worksheet
We hope students liked the above worksheet for Chapter 1 Population Distribution Density Growth and Composition designed as per the latest syllabus for Class 12 Geography released by CBSE. Students of Class 12 should download in Pdf format and practice the questions and solutions given in the above worksheet for Class 12 Geography on a daily basis. All the latest worksheets with answers have been developed for Geography by referring to the most important and regularly asked topics that the students should learn and practice to get better scores in their class tests and examinations. Studiestoday is the best portal for Class 12 students to get all the latest study material free of cost.
Worksheet for Geography CBSE Class 12 Chapter 1 Population Distribution Density Growth and Composition
Expert teachers of studiestoday have referred to the NCERT book for Class 12 Geography to develop the Geography Class 12 worksheet. If you download the practice worksheet for one chapter daily, you will get higher and better marks in Class 12 exams this year as you will have stronger concepts. Daily questions practice of Geography worksheet and its study material will help students to have a stronger understanding of all concepts and also make them experts on all scoring topics. You can easily download and save all revision worksheet for Class 12 Geography also from www.studiestoday.com without paying anything in Pdf format. After solving the questions given in the worksheet which have been developed as per the latest course books also refer to the NCERT solutions for Class 12 Geography designed by our teachers
Chapter 1 Population Distribution Density Growth and Composition worksheet Geography CBSE Class 12
All worksheets given above for Class 12 Geography have been made as per the latest syllabus and books issued for the current academic year. The students of Class 12 can be rest assured that the answers have been also provided by our teachers for all worksheet of Geography so that you are able to solve the questions and then compare your answers with the solutions provided by us. We have also provided a lot of MCQ questions for Class 12 Geography in the worksheet so that you can solve questions relating to all topics given in each chapter. All study material for Class 12 Geography students have been given on studiestoday.
Chapter 1 Population Distribution Density Growth and Composition CBSE Class 12 Geography Worksheet
Regular worksheet practice helps to gain more practice in solving questions to obtain a more comprehensive understanding of Chapter 1 Population Distribution Density Growth and Composition concepts. Worksheets play an important role in developing an understanding of Chapter 1 Population Distribution Density Growth and Composition in CBSE Class 12. Students can download and save or print all the worksheets, printable assignments, and practice sheets of the above chapter in Class 12 Geography in Pdf format from studiestoday. You can print or read them online on your computer or mobile or any other device. After solving these you should also refer to Class 12 Geography MCQ Test for the same chapter.
Worksheet for CBSE Geography Class 12 Chapter 1 Population Distribution Density Growth and Composition
CBSE Class 12 Geography best textbooks have been used for writing the problems given in the above worksheet. If you have tests coming up then you should revise all concepts relating to Chapter 1 Population Distribution Density Growth and Composition and then take out a print of the above worksheet and attempt all problems. We have also provided a lot of other Worksheets for Class 12 Geography which you can use to further make yourself better in Geography
You can download the CBSE Printable worksheets for Class 12 Geography Chapter 1 Population Distribution Density Growth and Composition for latest session from StudiesToday.com
Yes, you can click on the links above and download Printable worksheets in PDFs for Chapter 1 Population Distribution Density Growth and Composition Class 12 for Geography
Yes, the Printable worksheets issued for Class 12 Geography Chapter 1 Population Distribution Density Growth and Composition have been made available here for latest academic session
You can easily access the links above and download the Class 12 Printable worksheets Geography Chapter 1 Population Distribution Density Growth and Composition for each chapter
There is no charge for the Printable worksheets for Class 12 CBSE Geography Chapter 1 Population Distribution Density Growth and Composition you can download everything free
Regular revision of practice worksheets given on studiestoday for Class 12 subject Geography Chapter 1 Population Distribution Density Growth and Composition can help you to score better marks in exams
Yes, studiestoday.com provides all latest NCERT Chapter 1 Population Distribution Density Growth and Composition Class 12 Geography test sheets with answers based on the latest books for the current academic session
Yes, studiestoday provides worksheets in Pdf for Chapter 1 Population Distribution Density Growth and Composition Class 12 Geography in mobile-friendly format and can be accessed on smartphones and tablets.
Yes, worksheets for Chapter 1 Population Distribution Density Growth and Composition Class 12 Geography are available in multiple languages, including English, Hindi