
Read and download free pdf of CBSE Class 11 Economics Measures Of Central Tendency Assignment. Get printable school Assignments for Class 11 Economics. Class 11 students should practise questions and answers given here for Statistics For Economics Chapter 5 Measures Of Central Tendency Economics in Class 11 which will help them to strengthen their understanding of all important topics. Students should also download free pdf of Printable Worksheets for Class 11 Economics prepared as per the latest books and syllabus issued by NCERT, CBSE, KVS and do problems daily to score better marks in tests and examinations
Assignment for Class 11 Economics Statistics For Economics Chapter 5 Measures Of Central Tendency
Class 11 Economics students should refer to the following printable assignment in Pdf for Statistics For Economics Chapter 5 Measures Of Central Tendency in Class 11. This test paper with questions and answers for Class 11 Economics will be very useful for exams and help you to score good marks
Statistics For Economics Chapter 5 Measures Of Central Tendency Class 11 Economics Assignment
Points to Remember :-
* A central tendency is a single figure that represents the whole mass of data.
* Arithmetic mean or mean is the number which is obtained by adding the values of all the items of a series and dividing the total by the number of items.
* When all items of a series are given equal importance than it is called simple arithmetical mean and when different items of a series are given different weights according with their relative importance is known weighted arithmetic mean.
* Median is the middle value of the series when arranged in ascending order.
* When a series is divided into more than two parts, the dividing values are called partition values.
* If a statistical series is divided into four equal parts, the end value of each part is called a quartile and denoted by ‘Q’.
* The first quantile or lower quartile (Q1) is that value which divides the first half of an orderly arranged series into two equal parts.
* Third quartile or upper quartile (Q3) is that value which divides the latter half of an ascending orderly arrenged series into two equal parts.
* Mode is the value which occurs most frequently in the series, that is modal value has the highest frequency in the series.
* Main purposes and functions of averages.
(i) To represent a brief picture of data.
(ii) Comparison.
(iii) Formulation of policies.
(iv) Basis of statistical analysis.
(v) One value for all the group or series.
* Essentials of a good average.
(i) Easy to understand.
(ii) Easy to compute
(iii) Rigidly defined.
(iv) Based on all the items of series.
(v) Certain in character
(vi) Least effect of a change in the sample.
(vii) Capable of algebraic treatment.
* Merits of Arithmatic mean
(i) Simplicity
(ii) Certainty
(iii) Based on all values.
(iv) Algebraic treatment possible.
(v) Basis of comparision.
(vi) Accuracy test possible.
* Demerits of Arithmatic mean.
(i) Effect of extreme values.
(ii) Mean value may not figure in the series
(iii) unsuitability.
(iv) Misleading conclusions.
(v) Can not be used in case of qualitative phenomenon.
* Merits of Median
(i) Simple measure of central tendency.
(ii) It is not affected by extreame observations.
(iii) Possible even when data is incomplete.
(iv) Median can be determined by graphic presentation of data.
(v) It has a definite value.
* Demerits of median.
(i) Not based on all the items in the series.
(ii) Not suitable for algebraic treatment.
(iii) Arranging the data in ascending order takes much time.
(iv) Affected by fluctuations of items.
* Merits of mode
(i) Simple and popular measure of central tendency.
(ii) It can be located graphically with the help of histogram.
(iii) Less effect of marginal values.
(iv) No need of knowing all the items of series.
(v) It is the most representative value in the given series.
* Demerits of mode
(i) It is an uncertain measure
(ii) It is not capable of algebrate treatment.
(iii) Procedure of grouping is complex.
(iv) It is not based on all observations.
* Relation among mean, median and mode
Mode = 3 median - 2 mean
* Location of median by graph -
(i) By ‘Less than’ or ‘More than’ ogives method a frequency distribution series is first converted into a less than or more than cummulative series as in the case of ogives, data are presented graphically to make a ‘less than’ or ‘more than’ ogive N/2 item of the series is determined and from this print (on the y-axis of the graph) a perpendicular is drawn to the right to cut the cummulative frequency curve. The median value is the one where cummulative frequency curve cuts corresponding to x-axis.
(ii) Less than and more than ogive curve method present the data graphically in the form of ‘less than’ and ‘more than’ ogives simultamously. The two ogives are superimposed upon each other to determine the median value. Mark the point where the ogive curve cut each other, draw a perpendicular from that point on xaxis, the corresponding value on the x-axis would be the median value.
* Graphic representation of mode -
Prepare a histogram from the given data find out the ractangle whose hight is the highest. This will be the modal class. Draw two lines - one joining the top right point of the ractangle preceding the modal class with top right point of the modal class. The other joining the top left point of the modal class with the top left point of the post modal class. From the point of intersection of these two diagonal lines, draw a perpendicular on horizontal axis i.e. x-axis the point where this perpendicular line meets x-axis, gives us the value of mode.
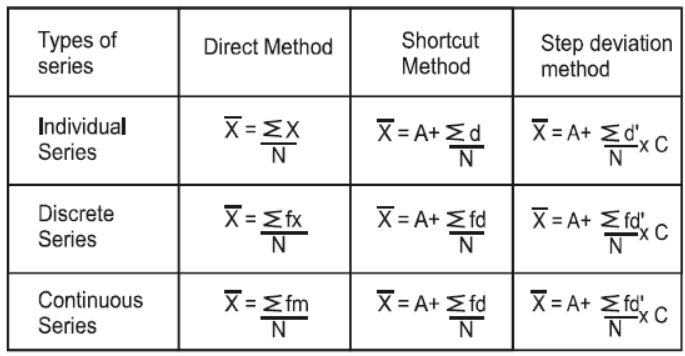
* Formulae of calculating arithmatic mean -
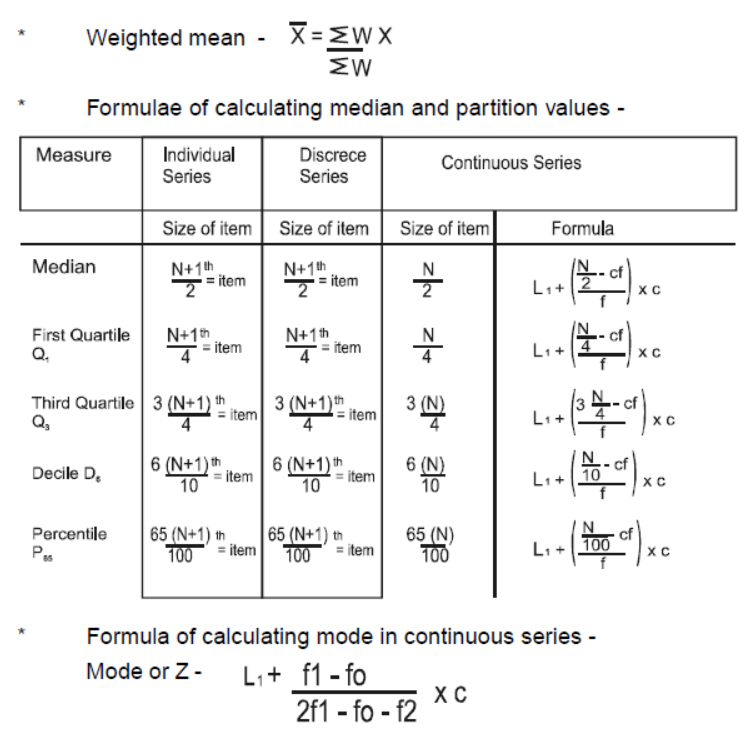
Where, L1 = Lower limit of modal class
fo = Frequency of the group preceding the modal class
f1 = Frequency of the modal class.
f2 = Rrequency of the group succeeding the modal class
c = Magnitude or class interval of the modal class
MCQ Questions Class 11 Economics Measures Of Central Tendency
(b) Symmetry
(c) Central tendency
(d) Dispersion
(b) The best scores
(c) Extreme scores
(d) Z-scores
(b) The mean
(c) The range
(d) Standard deviation
(b) Geometric mean
(c) Median
(d) Harmonic mean
(b) Lower limit
(c) Upper limit
(d) Lower class boundary
(b) Geometric mean
(d) Lower and upper quartiles
(b) Statistic
(c) Variable
(d) Constant
(b) Continuous variable
)c) Parameter
(d) Sampling unit
(b) Extremely small values
(d) Extremely large values
(b) Adding the constant
(d) Dividing the constant
(b) The median has an effect on extreme scores
(d) Extreme scores have an effect on the median
(b) Raising the mean
(c) No effect
(d) None of the above
(b) Raising the mean
(c) No effect
(d) Difficult to tell
(b) Some times equal to zero
(d) Less than zero
(b) Maximum
(c) Minimum
(d) All of the above
(b) 50
(c) 60
(d) 100
(b) 25
(c) -25
(d) 35
(b) Geometric mean
(c) Median
(d) Arithmetic mean

(b) 2
(c) 100
(d) 200
(b) Geometric mean
(c) Weighted mean
(d) Harmonic mean
(b) 20
(c) 200
(d) 20 + 10
(b) 10
(c) 12
(d) 20
(b) 5
(c) 7
(d) 10
(b) Infinity
(c) Impossible
(d) Difficult to tell
(b) 1.1
(c) 10.1
(d) 11
(b) Rs. 59.00
(c) Rs. 57.60
(d) Rs. 57.10
(b) Median
(c) Mode
(d) Geometric mean
(b) Geometric mean
(c) Weighted mean
(d) Mode
(b) Geometric mean
(c) Harmonic mean
(d) Weighted mean
(b) Harmonic mean
(c) Weighted mean
(d) Combined mean
(a) 4
(b) 5
(c) 6
(d) 90
(a) Mean
(b) Median
(c) Lower quartile
(d) Upper quartile
(a) Cumulative frequencies
(b) Relative weights
(c) Relative frequencies
(d) Array
(a) Mean
(b) Median
(c) Mode
(d) Geometric mean
(a) They may have no effect on it
(b) They may tend to raise it
(c) They may tend to lower it
(d) None of the above
(a) Mean
(b) Median
(c) Mode
(d) Geometric mean
(a) Mode
(b) Median
(c) Mean
(d) Harmonic mean
(a) Mean
(b) Median
(c) Weighted mean
(d) Geometric mean
(a) Mean
(b) Mode
(c) Median
(d) Q3
(a) Quartiles
(b) Deciles
(c) Percentiles
(d) Difficult to tell
(a) 40
(b) 50
(c) 60
(d) (60 – 40) / 2
(a) Q3 < 75
(b) Q3 < 30
(c) Q3 = 30
(d) Q3 > 30
(b) Q1 < 50
(c) Q1 > 50
(a) Q1 > 75
(b) Q1 = 75
(c) Q3 = 75
(d) Q3 > 75
(a) D4 ≠ 40
(b) D4 < 40
(c) D4 > 40
(d) D4 = 40
(a) P15 = 70
(b) P85 = 15
(c) P85 = 70
(d) P70 = 70
(b) 5th decile
(c) 50th percentile
(b) D5 = 50
(c) P50 = 50
(d) All of the above
(b) Maximum
(c) Odd number
(d) Even number
(b) Mode
(c) Median
(d) Geometric mean
(b) they tend to lower it
(d) difficult to tell
(b) Median
(c) Mode
(d) Percentile
(b) Median
(c) Mode
(d) All of the above
(b) 2
(c) 3
(b) Bimodal
(c) Multimodal
(d) Normal
(b) T
(c) Both S and I
(d) Both S and T
(b) Arithmetic mean = Geometric mean = Harmonic mean
(b) Mean - Median = 2(Median - Mode)
(d) Mode – Median = 2Mean – 2Median
(b) (2Mean + Mode) / 3
(d) 3Median - Mode
(b) 2Mean + Mode
(d) (3Median - Mode) / 2
(b) 3Median – 2Mean
(b) 30
(c) 45
(d) 180
(b) 10
(c) 30
(d) 60
(c) 16
(d) 15
(a) Mean = Median = Mode
(b) Mean < Median < Mode
(c) Mean > Median > Mode
(d) Mean + Median + Mode
(a) Skewed to the left
(b) Skewed to the right
(c) Multimodal
(d) Symmetrical
(a) Positively skewed
(b) Negatively skewed
(c) Symmetrical
(d) Both (b) and (c)
(a) Always equal to zero
(b) Some times equal to zero
(c) Never equal to zero
(d) Less than zero
(b) Negatively skewed
(c) Symmetrical
(d) Normal
(b) Geometric mean
(c) Harmonic mean
(d) Combined mean
(a) Arithmetic mean
(b) Lower and upper quartiles
(c) Geometric mean
(d) Harmonic mean
(a) Geometric mean
(b) Harmonic mean
(c) Combined mean
(d) Population mean
(a) 10
(b) 1/100
(c) 10%
(d) 1.1
(a) 20
(b) 1/20
(c) 20%
(d) 100%
(a) Mean
(d) Median
(c) Geometric mean
(d) Harmonic mean
(a) 6
(b) 4
(c) 14/3
(d) 8
(a) Proportions
(b) Ratios
(c) Percentage rates
(a) 3
(b) 9
(c) 27
(d) 81
(a) Zero
(b) Infinity
(c) Impossible
(d) Negative
(a) 4 (b) 0
(c) -2 (d) Impossible
(a) Arithmetic mean
(b) Geometric mean
(c) Harmonic mean
(d) Mode
(a) Median
(b) Arithmetic mean
(c) Mode
(d) Harmonic mean
(a) Small values
(b) Large values
(c) Positive values
(d) Negative values
(a) 9.5
(b) 6.2
(c) 0
(d) Impossible
(a) 4
(b) 10
(c) 16
(d) 20
(a) -5
(b) 5
(c) 0
(d) ∞
(a) Arithmetic mean
(b) Geometric mean
(c) Harmonic mean
(d) All of the above
(a) A.M > G.M > H.M
(b) G.M > A.M > H.M
(c) H.M > G.M > A.M
(d) A.M < G.M < H.M
(a) Harmonic mean
(b) Median
(c) Mode
(d) Lower and upper quartiles
(a) 0 and 3
(b) 3 and -3
(c) 0 and 0
(d) Impossible
(a) 4
(b) 8
(c) 16
(d) 64
(a) 4
(b) 8
(c) 16
(d) 32
(a) 4
(c) 24
(d) 128
(a) Geometric mean and Median
(b) Harmonic mean and Mode
(c) Simple mean and Weighted mean
(d) Geometric mean and Harmonic mean
(a) Mean
(b) Median
(c) Harmonic mean
(d) Geometric mean
(a) A.M = G.M = H.M
(b) A.M ≠ G.M ≠ H.M
(c) A.M > G.M > H.M
(d) A.M < G.M < H.M
(a) Origin
(b) Scale
(c) Both (a) and (b)
(d) None of the above
(a) 0
(b) 2
(c) 3
(d) No mode
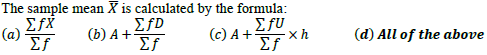
Question :
![]()
(a) 2
(b) 3
(c) 1/2
(d) 1/3
Answer : A
(b) Rs.57
(c) Rs.56
(d) Rs.59
Answer : D

ONE MARK QUESTIONS
Question. What is meant by central tendency?.
Answer: A Single figure that represents the whole series is known as central tendency.
Question. What are the types of mean?.
Answer: There are two types of mean - simple and weighted.
Question. Name any two partition values.
Answer: (i) Quartile (ii) Decile (iii) Percentile
Question. Give the meaning of arithmatic average.
Answer: When the sum of all items is divided by their number is known as arithmatic average.
Question. Define mode.
Answer: The value which occurs most frequently in series is known as mode.
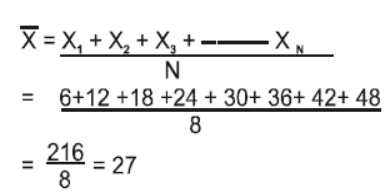
Question. Pocket money of 8 students is Rs. 6,12,18, 24, 30, 36, 42 and 48, calculate mean.
Answer:
Question. Write the formula for weighted mean.
Answer:
Question. What is the relation among the mean, median and mode?
Answer: Mode = 3 median - 2 mean
Question. Which partition value divide the total set of values into four equal parts.
Answer: Quartile
Question. Give the meaning of combined mean.
Answer: When the mean of two or more than two series is computed collectively, it is known as combined mean.
Question. A shoes manufacturing company only manufactures shoes for adults. Company wants to know the most popular size. Which type of central tendency will be the most appropriate?
Answer: Mode
Question. Which diagram is used for finding the value of mode graphically?
Answer: Histogram
Question. Mention one demerit of mode.
Answer: One demerit of mode is that it is not capable of algebraic treatment.
Question. If the values of mean and median are 40 and 48. Find out the most probable value of mode.
Answer: Mode = 3 median - 2 mean
= (3x 48) - (2 x 40) = 144 - 80
= 64
Question. Calculate mode from the following data 10, 8, 10, 6, 4, 12, 10, 8, 10, 18, 16, 10, 18, 10, 10.
Answer: Mode = 10
Question. How is the value of median computed with the help of ogive curves?.
Answer: The point of intersection where ‘less than’ ogive curve and ‘morethan’ ogive curve intersect each other gives us the value of mediam.
Question. What is positional average?
Answer: Those averages whose value is worked out on the basis of their position in the statistical series.
Question. What is the sum of deviations taken from mean in a series.
Answer: Zero.
MARKS QUESTIONS
1. Give four objectives of statistical average.
2. Show that the sum of deviations of the values of the variable from their arithmatic mean is equal to zero.
3. Write the merits of median.
4. Calculate median from the following data

5. State three advantages of mode.
6. What are four demerits of mean.
7. Average income of 50 families is Rs. 3000. Average income of 12 families is Rs. 18000. Find the average income of rest of the families (Ans. 3378.95)
8. What are the essentials of a good average.
9. Mean marks obtained by a student in his five subjects are 15 in english he secures 8 marks, in economics 12, in mathematics 18 and in commerce 9, Find out the marks he secured in statisties.
10. What is meant by weighted arithmatic mean? How is it calculated?.
11. Name and define three statistical averages.
12. State any two reasons of difference between median and mode.
13. Explain the characterstics, merits and demerits of mean.
| CBSE Class 11 Economics Indian Economy on the Eve of Independence Assignment |
| CBSE Class 11 Economics Agriculture Assignment |
| CBSE Class 11 Economics Economic Reforms Since 1991 Assignment |
| CBSE Class 11 Economics Poverty Assignment |
| CBSE Class 11 Economics Human Capital Formation in India Assignment |
| CBSE Class 11 Economics Rural Development Assignment |
| CBSE Class 11 Economics Growth Informalisation Assignment |
| CBSE Class 11 Economics Infrastructure Assignment |
| CBSE Class 11 Economics Environment and Sustainable Development Assignment |
| CBSE Class 11 Economics Development Experience of India Assignment |
| CBSE Class 11 Economics Introduction Assignment |
| CBSE Class 11 Economics Collection of Data Assignment |
| CBSE Class 11 Economics Organisation and Presentation of Data Assignment |
| CBSE Class 11 Economics Presentation of Data Assignment |
| CBSE Class 11 Economics Measures Of Central Tendency Assignment |
| CBSE Class 11 Economics Measures Of Dispersion Assignment |
| CBSE Class 11 Economics Correlation Assignment |
| CBSE Class 11 Economics Introduction to index numbers Assignment |
More Study Material
CBSE Class 11 Economics Statistics For Economics Chapter 5 Measures Of Central Tendency Assignment
We hope you liked the above assignment for Statistics For Economics Chapter 5 Measures Of Central Tendency which has been designed as per the latest syllabus for Class 11 Economics released by CBSE. Students of Class 11 should download and practice the above Assignments for Class 11 Economics regularly. We have provided all types of questions like MCQs, short answer questions, objective questions and long answer questions in the Class 11 Economics practice sheet in Pdf. All questions have been designed for Economics by looking into the pattern of problems asked in previous year examinations.
Assignment for Economics CBSE Class 11 Statistics For Economics Chapter 5 Measures Of Central Tendency
Our team of expert teachers have referred to NCERT book for Class 11 Economics to design the Economics Class 11 Assignments. If you practice at least one test paper daily, you will get higher marks in Class 11 exams this year. Daily practice of Economics course notes and related study material will help you to clear all your doubts and have stronger understanding of all concepts. You can download all Revision notes for Class 11 Economics also from www.studiestoday.com absolutely free of cost.
Statistics For Economics Chapter 5 Measures Of Central Tendency Assignment Economics CBSE Class 11
All questions and their answers for the assignment given above for Class 11 Economics have been developed as per the latest curriculum and books issued for the current academic year. The students of Class 11 can rest assured that the best teachers have designed the questions of Economics so that you are able to revise the entire syllabus if you do the assignments. Lot of MCQ questions for Class 11 Economics have also been given in the worksheets and assignments for regular use. All study material for Class 11 Economics students have been given on studiestoday.
Statistics For Economics Chapter 5 Measures Of Central Tendency Assignment CBSE Class 11 Economics
Regular assignment practice helps to get a more comprehensive understanding of Statistics For Economics Chapter 5 Measures Of Central Tendency concepts. Assignments play a crucial role in understanding Statistics For Economics Chapter 5 Measures Of Central Tendency in CBSE Class 11. Students can download all the assignments of the same chapter in Class 11 Economics in Pdf format. You can print them or read them online on your computer or mobile.
CBSE Economics Class 11 Statistics For Economics Chapter 5 Measures Of Central Tendency Assignment
CBSE Class 11 Economics latest books have been used for coming up with the latest questions and solutions for the above assignment. If you have revised all concepts relating to Statistics For Economics Chapter 5 Measures Of Central Tendency then you should attempt all questions given in the test sheets above. We have also provided lot of Worksheets for Class 11 Economics which you can use to further make your self stronger in Economics
You can download free Pdf assignments for CBSE Class 11 Economics Statistics For Economics Chapter 5 Measures Of Central Tendency from StudiesToday.com
The Statistics For Economics Chapter 5 Measures Of Central Tendency Class 11 Economics Assignments have been designed based on latest CBSE syllabus for Class 11 Economics issued for the current academic year
Yes, These printable assignments for Statistics For Economics Chapter 5 Measures Of Central Tendency Class 11 Economics are free to download and print
All topics given in Statistics For Economics Chapter 5 Measures Of Central Tendency Economics Class 11 Book for the current academic year have been covered in the given assignment
No, all Printable Assignments for Statistics For Economics Chapter 5 Measures Of Central Tendency Class 11 Economics have been given for free and can be downloaded in Pdf format
Just click on the View or Download button below, then another window with the Pdf will be visible, just click on the Pdf icon to download the free assignments for Statistics For Economics Chapter 5 Measures Of Central Tendency Class 11 Economics
Yes, apart from Economics you can download free assignments for all subjects in Class 11
Our team of expert teachers at studiestoday.com have provided all answers for the practice questions which have been given in Class 11 Economics Statistics For Economics Chapter 5 Measures Of Central Tendency assignments